 |
| |||||
|
| ||||||||
|
| ||||||||
Home  Publications Publications |
|
|
Note to the Reader This is a preprint of a paper in press at Behavior Genetics. Cite as: Williams RW, Airey DC, Kulkarni A, Zhou G, Lu L (2000) Genetic dissection of the olfactory bulb of mice: QTLs on chromosomes 4, 6, 11, and 17 modulate bulb size. Behavior Genetics: in press. Contents Introduction ABSTRACT Olfaction is influenced by a complex mix of environmental factors and
genes that modulate the production, migration, and maturation of cells in
the olfactory bulbs. In this study we analyzed effects of sex, age, and
brain weight on olfactory bulb size in sexually mature mice. Regression
corrected values (residuals) were used to map four quantitative trait loci
(QTLs) that selectively modulate bulb weight. Traits were mapping using
C57BL/6J (B6) and DBA/2J (D2) parental strains, an F2 intercross, and 35
BXD recombinant inbred strains. The olfactory bulbs are a highly conserved but highly variable part of
the vertebrate forebrain (Allison, 1953; Gittleman, 1991; Royet et al.,
1998). They can be identified unambiguously in virtually every vertebrate,
and unlike most CNS regions, establishing their homology across diverse
vertebrate classes is simple. However, the size of the olfactory bulbs
differs enormously across taxa. For example, large-brained apes, including
humans, have comparatively small olfactory bulbs, whereas smaller-brained
insectivores and rodents have comparatively large bulbs. This is probably
the best example of a violation of allometric scaling of CNS components.
Among a wide range of mammalian species, the correlation between bulb and
brain weight is significantly lower (r = 0.7) than similar correlations
for other parts of the CNS (r >0.95), the cerebellum, hippocampus,
neocortex, and medulla included (Finlay and Darlington, 1995). This
indicates that a subset of genetic and molecular mechanisms that are
important in bulb development and growth are likely to be distinct and
partly independent from those that modulate other parts of the forebrain.
There is already excellent support for this hypothesis at the genetic
level: for example, mutations in Pax6, Ncam, Igf1, and Fgf8 all produce
drastic effects on the olfactory bulbs but have minimal effects on
neocortex, hippocampus, striatum, or thalamus (Dellovade et al., 1998;
Tomasiewicz et al., 1993; Cheng et al., 1998, Cremer et al., 1994). We used two related crosses of mice to map QTLs controlling bulb
weight. The first consists of a set of 358 animals belonging to 35 BXD
recombinant inbred strains. These strains were generated by crossing
C57BL/6J (B6) and DBA/2J (D2) parental strains in the 1970s (BXD1 through
32) and 1990s (BXD33 through 42) (Taylor, 1989; Taylor et al., 1999). The
second set of animals consists of reciprocal F1 and F2 intercrosses that
were also generated by crossing B6 and D2 strains. The F2 animals were
produced at the University of Tennessee by mating B6D2F1 and D2B6F1 mice
as described in Zhou and Williams (1999): 103 animals were B6D2F2s and 71
were D2B6F2s (further abbreviated BDF2s and DBF2s). Mice were maintained
at 20–24 °C on a 14/10h light-dark cycle in a pathogen-free colony at the
University of Tennessee. Animals were fed a 5% fat Agway Prolab 3000 rat
and mouse chow. The average age of BXD/Ty animals was 80 days, whereas
that of F2 mice was 98 days. Total numbers of males and females are 349
and 321, respectively.
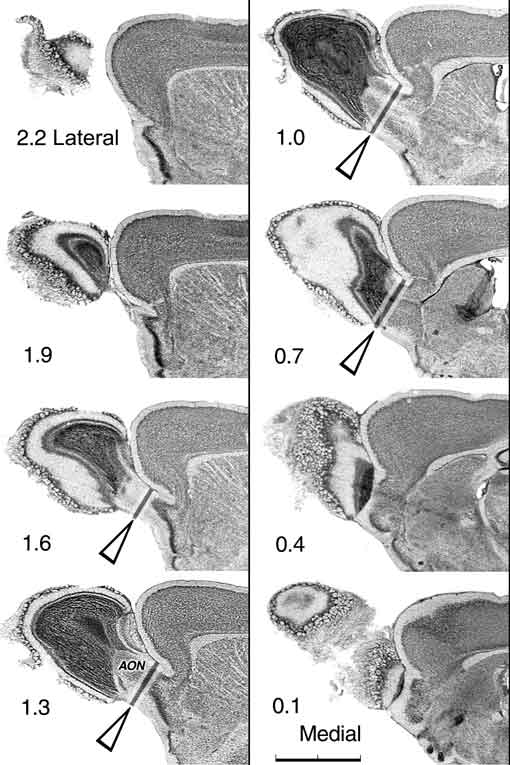
Figure 1. Olfactory bulb cut in the sagittal plane to illustrate the placement of the dissection cuts. The position of a dissection cut is represented by a dark bar flanked by light bars in four of the sections. Surface landmark criteria for making this cut are described in the text. As illustrated in the upper right and lower left micrographs, bulb weight does include a small component of the anterior olfactory nucleus (AON). These serial sections are space approximately 0.3 mm apart. The upper left section is approximately 2.2 mm lateral to the medial surface of the bulb. Scale bar in the lower right is 2 mm.
Fixation and dissection Mice were anesthetized deeply with Avertin (1.25% 2,2,2-tribromoethanol
and 0.8% tert-pentyl alcohol in water, 0.5–1.0 ml ip). Mice were perfused
through the heart with 0.1 M phosphate buffered saline followed by 1.25%
glutaraldehyde and 1.0% paraformaldehyde in 0.1 M phosphate buffer (2–4
min), and then with 2.5% glutaraldehyde and 2.0% paraformaldehyde in 0.1 M
buffer (1–2 min) at an increased flow rate.
Regression analysis Regression analysis was carried out using Data Desk 6.01 (Data Description, www.datadesk.com) to explore covariance between bulb weight and other variables. We explored associations between the weight of the olfactory bulbs—expressed as the summed weights of the two bulbs—with variation in brain weight excluding the bulbs, sex, logarithm of age, body weight, and the weights of the cerebellum and hippocampus. Our aim was to protect our QTL analysis against genes that have widespread effects on body and brain weight and to focus attention on the subset of genes that have more intense or selective effects on the olfactory bulbs. Our second purpose was to understand relations among sex, age, and brain weight. Previous work has reported no gain in olfactory bulb weight in adult mice as a function of age (Pomeroy et al., 1990), but in our large data set there is compelling evidence for such a relation. As part of this analysis we also tested for possible interaction effects among variables, for example to determine whether the increase in bulb weight as a function of age varies between males and females. The regression analysis was performed independently for the BXD and F2 cases. Genotyping and QTL mapping DNA was extracted from the spleens of F2 animals using a high-salt
procedure (Laird et al., 1991;
www.nervenet.org/papers/PCR.html). A set of 129 microsatellite loci
distributed across all autosomes and the X chromosome were typed in all
F2s using a standard PCR protocol (Love et al., 1990, Dietrich et al.,
1994) detailed by Lu and colleagues (2000).
In brief, each 10 µl PCR reaction contained 1X PCR buffer, 1.92 mM MgCl2,
0.25 units of Taq DNA polymerase, 0.2 mM of each deoxynucleotide, 132 nM
of the primers and 50 ng of genomic DNA. The microsatellite primer pairs
were purchased from Research Genetics, Huntsville, AL. A loading dye (60%
sucrose, 1.0 mM cresol red) was added to the reaction before the PCR (Routman
et al., 1994). PCRs were carried out in 96-well microtiter plates. We used
a high stringency touchdown protocol in which the annealing temperature
was lowered progressively from 60 °C to 50 °C in 2 degree steps over the
first 6 cycles. After 30 cycles, PCR products were run on 2.5% Metaphor
agarose gels (FMC Inc., Rockland ME), stained with ethidium bromide, and
photographed. F2 genotypes were read directly from photographs and entered
into Excel 98 and transferred to Map Manager QTb28 for mapping and
permutation analysis.
ResultsThe results are divided into two major sections. The first deals with normal variation in the size of the olfactory bulbs as a function of sex, age, brain and body weights. This systematic description of sources of variance in bulb weight is interesting in it own right, but is also a prerequisite to the second section of the results in which we summarize QTL mapping results. The rationale for the statistical treatment of phenotype data, as well as a more complete explanation of the linear regression methods, is provided in Williams (2000). In brief, we are attempting to ensure that the QTLs that we have mapped have specific or intense effects on the size of the mouse olfactory bulb. Variation in bulb size in normal miceVariation in the weight of the olfactory bulbs among normal sexually
mature mice is substantial. Bilateral bulb weight ranges from 10 to 30 mg
(Figs. 2, 3). Variation is substantial even among isogenic groups of mice.
For example, among our sample of C57BL/6J animals between 30 and 300 days
of age, bilateral bulb weight varied from 14.3 mg to 29.1 mg. After
correcting for sex, age, body weight, and brain weight, differences within
sets of isogenic animals are greatly reduced. The within-strain
coefficient of variation averages 3% (Table 1). This matches the
coefficient of variation in other parts of the mouse CNS (Williams et al.,
1996,
1998; Williams
2000; Lu et
al. 2000).
* Bilateral olfactory bulb weight after correction by multiple
regression for differences in logarithm of age, sex, body weight, and
brain minus olfactory bulb weight. All cases were adjusted to that of
75-day-old 22g female mice with a brain weight –bulb weight of 420 mg.
Figure 2. Relation between bilateral olfactory bulb weight and weight of the brain. The brain was reweighed just before dissecting both olfactory bulbs for this set of 853 mice (BXD, F2, and several groups of inbred strains not used for QTL analysis). Crosses and the upper regression line represent males; circles and the lower regression line represent females. The regression line for the both sexes combined is bulb = 0.06(brain–bulb) – 6.0. Subtracting bulb weight from that of the whole brain and recomputing the regression does not change the slope significantly but does change the y-intercept to –4.6 mg. The average bilateral sex difference in bulb weight is about 0.5 mg. Brain weight and olfactory bulb weight Variation in brain weight is the single most important predictor of
variation in bulb weight among genetically diverse groups of adult mice.
Fifty percent of the variation in bulb weight can be predicted given data
on brain weight (Fig. 2, Table 2). For the BXD mice treated as individuals
rather than as strain means, the line of best fit is olfactory bulb weight
(mg) = 0.054(brain weight in mg) – 3.51. Brain weight naturally includes
the weight of both bulbs; therefore, to compare structurally independent
variables, we subtracted olfactory bulb weight from brain weight and
recomputed regression equations. Although the slope is the same, the
amount of variance explained is reduced to 45%. Correlations between the
olfactory bulbs and other CNS components are surprisingly variable; the
correlation between bulb weight and hippocampal weight is only 0.35,
whereas that with the cerebellum is 0.70 (Table 2).
Age and olfactory bulb weight One of the more important results of this study is that the olfactory
bulbs grow substantially even in sexually mature mice. In retrospect,
given the constant influx of neurons via the rostral migratory stream,
this gain might be expected. Among our sample of BXD animals, which range
in age from 30 to 300 days, the slope of this increase is approximately
6.5 mg for a 10-fold increase in age. Mice are sexually mature by 50 days
of age, and over the next 200 days the summed weight of the two bulbs
increases by 6.0 ± 1.0 mg. This amounts to 0.2 mg/week, a 1.0% increase.
Variation in age among genetically diverse BXD mice accounts for 20% of
the variance in olfactory bulb weight. In the isogenic parental strain,
C57BL/6J, a remarkable 54% of the variance in bulb weight is accounted for
by age (Fig. 3, upper line and crossed points, Table 2).
We know that brain weight increases in adult mice as a function of age (Lu
et al., 2000) and therefore some increase in bulb weight is expected.
However, there is a significantly greater proportional increase in bulb
weight. After controlling for increases in brain weight as a function of
age, the olfactory bulbs still gain 4.6 mg between 50 and 250 days of age.
Sex and olfactory bulb weight On average, olfactory bulbs of males weigh 0.35 mg more each than those of females (Fig. 2, p <0.0001). In the sample of BXD mice, total brain weight of females at dissection averaged 8 mg more than that of males—432.3 ± 2.8 versus 424.2 ± 3.5 mg (p of 0.17 when brains weights are corrected for variation in age). After compensation for differences in brain weight and age, the adjusted sex difference in bulb weight between male and female BXD mice amounts to 0.7 mg bilaterally (p < 0.006). The same 0.7 mg difference was also noted among F2 intercross progeny. Although statistically significant and reliable across data sets, the 3.5% mean difference in olfactory bulb weight between the sexes is modest. While any statistically significant sex difference is often, and incorrectly, referred to as a sexual dimorphism, the overlap between sexes is very substantial and certainly does not produce two modes. Sex accounts for only 0.3% of the total variance in olfactory bulb weight. Body weight and olfactory bulb weight Body weight has a significant correlation of 0.56 with olfactory bulb weight in BXD mice (Table 2). An increase in body weight of 1 g is associated with an increase in bulb weight of 0.17 ± 0.01 mg per side. There is still a highly significant association between the weight of the body and that of the olfactory bulb, even after we control for variation in brain weight and sex. However, strong association between body and bulb is almost purely due to a common primary effect of age. After the addition of either age or the logarithm of age to a multiple regression analysis, body weight becomes an insignificant predictor of bulb weight (p = 0.21). In F2 mice body weight correlates only weakly with olfactory bulb weight (r = 0.26). Variation in body weight thus accounts for only ~7% of the variation in bulb weight. An increase in body weight of 1 gram is associated with an increase in olfactory bulb weight of 0.12 ± 0.035 mg.
Table 2. Correlation matrix for 8 traits among individual BXD animals
The lower left half of this table lists correlations between variables.
All correlations were computed using individual values from BXD animals (n
= 254 to 351). In the upper right half lists coefficients of determination
(R2).
Comparison of right and left bulbs Measured differences in weights of right and left bulbs are due to
biological differences and technical error. The mean difference between
the two sides averages 0.43 mg. Following a correction for small n,
this corresponds to a right-left coefficient of variation of 4.0% (Gurland
and Tripathi correction; Sokal and Rohlf, 1995). This value sets an upper
limit on variation generated by developmental noise and the magnitude of
error introduced by fixation and dissection. Multiple regression analysis To map QTLs that have specific or relatively intense effects on the olfactory bulbs, we corrected all bulb weight data by multiple linear regression using the function olfactory bulb weight (bilateral, fixed in mg) = 4.0 (logarithm of age in days)+ 0.059 (body weight in gm) + 0.046 (brain weight – olfactory bulb weight in mg) – 0.59 (if female) – 7.24 This linear model accounts for 58% of the variance among a
heterogeneous set of just over 600 animals. The predicted olfactory bulb
weight of a 75-day-old 22-gm female with a brain weight (minus the bulbs)
of 430 mg is 19.86 mg. The difference between the actual weight and the
predicted bulb weight is the residual value. These residuals (or the
equivalent regression adjusted olfactory bulb weights) were used for
mapping. olfactory bulb weight (bilateral, fixed in mg) = 4.59 (logarithm of age in days) – 0.0067 (body weight in gm) + 0.051 (brain weight – olfactory bulb weight in mg) – 0.63 (if female) –6.99 This equation accounts for approximately 42% of the variance among the F2 sample (n = 177). The mean of the adjusted weights for the F2 mice is 24.8 ± 0.1 mg (SE). The cumulative probability density plot for the F2 sample extends from 21 mg to 28 mg and has a prominent mode at approximately 24.5 mg and a minor mode at 26 mg. Strain differences in bulb weight At 75 days of age, the weight of the olfactory bulbs ranges from a low
of 18.1 mg in BXD36 to a high of 23.6 mg in BXD35 (Table 1). Values
adjusted only for age and sex average 20.5 ± 2.1 mg (SD) across the BXD
strains, and range from a low of 17.3 mg in BXD24 to a high of 24.4 mg in
BXD35. The range greatly exceeds the difference between D2 and B6 parental
strains (19.8 versus 22.7 mg unadjusted; 21.6 versus 21.9 mg adjusted).
QTL analysis of variance in bulb weightAn analysis of variance of BXD mice indicates that the broad-sense heritability of olfactory bulb weight ranges from 20% when computations are performed using completely unadjusted data to 27% for fully corrected values (Williams et al., 1996). The corresponding estimates of broad sense heritability derived by comparing variance of F1 and F2 progeny is ~33%. As noted above, after compensating for differences in brain weight there is essentially no difference in the weight of the bulbs between the parental strains (Table 1). In this situation it is not useful to apply the Castle-Wright equation to estimate the minimum number loci that modulate a quantitative trait (Wright, 1978). The output of the QTL analysis itself is far more germane in estimating numbers of modulatory loci (Grisel et al., 1997).
Figure 4. Probability density plots of olfactory bulb weights in 35 BXD strains. A. Olfactory bulb weight data adjusted only for variation in sex and age and prior to compensation by linear regression for variation in brain weight. The small distributions labeled D, B, and F1 are for the two parental strains and the two reciprocal F1 hybrids computed using the group average and the standard error of the mean (see Williams et al., 1996 for details). The parental and F1 distributions have been reduced in size relative to the probability density of the BXD set (bold curve). The fine normal distribution was computed using the average and standard deviation for all BXD strain averages. B. Similar probability density plot of olfactory bulb weight, but now with compensation for variation in brain weight. The bimodality evident in A is greatly reduced. The distribution in B was used for mapping and is based on values in the second column of Table 2.
Mapping olfactory bulb QTLs in BXD mice After factoring out much of the variability in bulb weight associated
with brain weight, sex, body weight, and age, we were able to map four
QTLs. We have used both simple and composite interval mapping to define
chromosomal regions associated with differences in bulb weight at a
genome-wide significance level of 0.05. All data on the centimorgan
positions of QTLs and microsatellite marker loci (the MIT loci) in this
section are taken from online mouse chromosome committee reports
maintained as part of the Mouse Genome Database (Mouse
Genome Database). [For sake a legability, locus symbols in this web
edition have often not be set in an italic font.]
Figure 5A Interval maps of Bulb1 on Chr 4 mapped using BXD strains. The thick black line corresponds to the BXD LRS values. The LRS = 4.6xLOD score and was computed at 1-cM intervals. The thin black line and the right axis indicates the estimated mean effect of replacing a single D allele with a B allele. The x-axis is the approximate positions of marker loci along the chromosomes measured in centimorgans (1 cM = approximately 2 million base pairs of DNA). The x-axis have been corrected to the chromosome committee report consensus values.
Figure 5B Interval maps of Bulb1 on Chr 4 mapped using F2 progeny. The thick black line corresponds to the LRS values. The LRS = 4.6xLOD score and was computed at 1-cM intervals. The thin black line and the right axis indicates the estimated mean effect of replacing a single D allele with a B allele.
Figure 5C Interval maps of Bulb2 on Chr 6 mapped using BXD strains. There is a good possibility that Bulb2 represents two linked QTLs. Other conventions as in Fig. 5A above.
Figure 5D Interval maps of Bulb2 on Chr 6 mapped using F2 progeny.
Figure 5E Interval maps of Bulb3 on Chr 11 mapped using BXD strains.
Figure 5F Interval maps of Bulb3 on Chr 11 mapped using F2 progeny.
Figure 5G Interval maps of Bulb4 on Chr 17 mapped using BXD strains.
Figure 5H Interval maps of Bulb4 on Chr 17 mapped using F2 progeny. Other conventions as in Fig 5A above.
Mapping olfactory bulb QTLs using the F2 intercross Analysis of the F2 data set provides strong support for all four
primary intervals identified using the BXD set (Fig 5B, D, F, H). In each
case the polarity of effects of B and D alleles is the same in the F2 as
in the BXD set.
Epistasis We tested for pair-wise epistatic interactions among the four intervals with the largest effects in the BXD setÑthose on chromosomes 4, 6, 11, and 17. No significant nonlinear interactions were uncovered. The effects of the Chr 4 and Chr 6 intervals add together and the B/B two-locus genotype has a bulb weight 1.9 mg greater than that of the D/D genotype. The corresponding difference among the F2 animals with these genotypes is very closely matched at 1.7 mg. The double heterozygotes (H/H) had an intermediate bulb weight. Conversely, the effects of the Chr 11 and Chr 17 intervals add together and the B/B genotype has a bulb weight 2.4 mg less than that of the D/D genotype. In the F2 the difference between these two genotypes is 1.9 mg; again a fairly close match between data sets. The cumulative modulation of all four intervals acting together is not as great as expected, indicating possible saturation of effects on the bulb, weak epistasis, or overestimation of single QTL effects. Eight BXD strains had the four-locus genotype expected to have the largest bulb size (B/B/D/D) and five strains had the opposite four-locus genotype expected to have the smallest bulb size (D/D/B/B). These two extreme groups had average bulb weights that differed by 3.25 mg, not the predicted 5.5 mg difference expected if allelic effects at all four loci added linearly. It is likely that single QTL effects are more modest than our initial estimates. DiscussionSynopsis The four QTLs that we have mapped modulate the weight of the olfactory bulbs over a range of 3–5 mg, equivalent to a 20% gain or loss in weight. These QTLs are the first members of what is probably a larger set of normally polymorphic genes that influence bulb development. The difference in bulb size among the BXD recombinant inbred strains is sufficiently large to motivate a search for underlying anatomical effects on cell populations and numbers of glomeruli. This may even be a large enough difference to motivate a search for corresponding behavioral variation. The four bulb-specific QTLs identified in this cross between C57BL/6J and DBA/2J can be divided into pairs in which alleles inherited from the parental strains that have opposing effects of 0.5 to 1.0 mg each. Relations between structure and behavior Research in behavioral genetics typically progresses directly from
allelic variants to behavioral variants without the intermediate analysis
of transmitter systems, cells, or CNS nuclei. There are good reasons for
side-stepping the neuroanatomy. Quantitative analysis of structural
variation is often difficult and may lack sufficient power or precision to
demonstrate functional relations with behavior. But studies of behavioral
variants eventually need to return to the neuroanatomical and molecular
biology of the brain. In the present study we have reversed the sequence
and have started by establishing linkage between allelic variants and
structural variants (Williams, 2000). The 30–40% difference in bulb weight
between animals that we have exploited to map QTL is an excellent target
for correlated behavioral analysis. For example, Gheusi and colleagues
(2000) have recently shown that a 30–40% reduction in bulb size associated
with blocking the movement of cells along the rostral migratory stream in
mice leads to a significant loss in the ability to discriminate odors. It
will be interesting to determine if normal variants that match
experimental variants in terms of magnitude of the phenotypic effect will
show similar behavioral differences.
Figure 6. Tight correlation between the size of the olfactory bulb and the number of glomeruli. Data were extracted from a developmental analysis of the CF1 strain (Pomeroy et al., 1990; their figures 3C and 4). Bulb size, reexpressed here in milligrams, is an estimate based on the volume measured in histological sections. The equation of the regression line is n glomeruli = 244 + 200(bulb weight in mg).
Relation between glomerular architecture and bulb weight The weight of the bulb increases from 0.8 mg at birth to 8.0 mg at 80
days (Pomeroy et al., 1990). Over this period the number of glomeruli
increases approximately 5-fold, from 400 to 2000, by a process in which
small new glomeruli intercalate between large old glomeruli (LaMantia et
al., 1992). The number of synapses per glomerulus increases nearly
30-fold, from 7000 to 200,000 (Pomeroy et al., 1990). Correlations among
these variables are high. Our reanalysis of figures reproduced in the
paper by Pomeroy and colleagues (1990) demonstrates that the correlation
between the logarithm of age and number of glomeruli is 0.95, whereas that
between bulb volume and number of glomeruli is 0.99 (Fig 5). For each 1 mg
increase in the weight of the bulb, numbers of glomeruli increase by 200.
We do not yet know whether these strong correlations apply with equal
force across different genotypes, but if they do, then BXD35 mice should
have an average of 700 more glomeruli per bulb than do BXD24 mice (Table
1). There are no technical impediments to determining cellular (and
glomerular) correlates of differences in bulb weight other than the
requirement to apply relatively high-throughput quantitative morphometric
methods. Even this problem has been partly solved: high-resolution images
(5 µm/pixel) of serial Nissl-stained sections cut through the bulbs of all
strains included in this study are now available online as part of the
Mouse Brain Library collection (Rosen et al.,
2000;
Williams and Rosen, www.mbl.org). It
should be practical to rapidly assess the degree to which different layers
and parts of the olfactory bulb (and accessory olfactory nucleus) vary as
a function of bulb weight using the stereological method detailed so
carefully by Royet and colleague (1989, 1998). A comparison with QTLs that modulate size of hippocampus and cerebellum In recent work we have used the same groups of mice to map QTLs that modulate the size of the eye (Zhou and Williams, 1999), the brain (Strom, 1999), the dorsal lateral geniculate nucleus (Kulkarni et al., 2000), the caudate (Rosen and Williams, 2000), the hippocampus (Lu et al., 2000), and the cerebellum (Airey et al. 2000). Two of these areas— the cerebellum and hippocampus—are of particular interest. Like the olfactory bulbs, both possess large populations of late-generated granule cells. Polymorphic genes that influence late stages of neurogenesis might be expected to have common effects on all three structures (Finlay and Darlington, 1995). The correlations between weights of these three structures given in Table 2, indicates a much closer coupling between bulb and cerebellum (R2 = 0.49, than between bulb and hippocampus (R2 = 0.13). QTLs for cerebellum map to chromosomes 1, 8, 14, and 19, whereas those for hippocampus map to distal Chr 1 and the proximal Chr 5 (Lu et al., 2000). In contrast, the four Bulb loci map to chromosomes 4, 6, 11, and 17. Thus the Bulb loci do not overlap any of hippocampus- or cerebellum-specific QTLs. The apparent lack of shared genetic control does not mean that cell proliferation and growth in the bulb is autonomous from that in the hippocampus and cerebellum. In fact, we know that genes such as Zipro1 (Yang et al., 1999) are expressed in all three of these granule-cell-rich regions. We have not yet detected QTLs with widespread effects primarily because the regression techniques intentionally highlights QTLs with selective effects. Effects of age on the size of the olfactory bulbs We have shown that the olfactory bulb grows significantly in adult
mice. This finding amplifies earlier work that unequivocally demonstrated
the addition of new glomeruli in young but sexually mature mice (Pomeroy
and et al., 1990). In contrast to previous work (Maruniak et al., 1989;
LaMantia et al., 1992; Baker et al., 1995), our results also demonstrate
that olfactory bulb size does not reach an adult asymptote until very late
in life—probably after 300 days of age in strains such as C57BL/6J and
A/J. This continued growth appears close to linear when weight data are
plotted against the logarithm of age (Fig. 3, note for example the
circular data points from strain A/J). Naturally, on a conventional linear
time scale, the pace of olfactory bulb growth decelerates at a neat
logarithmic rate. This is consistent with the reduction in numbers of
neurons delivered to the olfactory bulbs over the rostral migratory stream
as a function of age (Tropepe et al., 1997). [To explore the limits of
bulb growth, and of glomerular addition and adult neuron proliferation,
will require access to genetically uniform mice that are significantly
older than 300 days. Such mice are available from the mouse colony
supported by the National Institute of Aging (see
www.nih.gov/nia/research/resources.htm).] Candidate genes for the Bulb QTLs Once the chromosomal positions of the QTLs have been determined to a precision of 1–3 cM, it will be appropriate to assess merits of candidate genes (Rikke and Johnson, 1998). To achieve this level of precision we have generated a large set tenth-generation advanced intercross progeny (Darvasi, 1998; G. Zhou and R. Williams, unpublished) using as starting material the F2 animals mapped in the present study. We are also developing a new technique for high-resolution (subcentimorgan) QTL mapping that like RI strain mapping, obviates the need to genotype any animals (Williams et al., 2000). Given the complexity of bulb development, candidates within QTL intervals will include genes known to be expressed in the olfactory epithelium, the cephalic neural crest, the forebrain, the subventricular zone, the rostral migratory stream, and of course, the olfactory bulb itself.
Acknowledgement This research project was support by a grant from the National Institute of Neurological Disorders and Stroke (R01 NS35485). The authors thank Drs. Jing Gu and Xiyun Peng for their assistance in generating, processing, and genotyping F2 and BXD mice. We thank Ms. Leslie Jones for her help generating data for inbred strains. We thank Kathryn Graehl for editing this paper.
REFERENCES Airey DC, Lu L, Williams RW (2000) Gene loci for mouse cerebellum and internal granule layer size. Soc Neurosci Abst 26: in press. Allison AC (1953) The morphology of the olfactory system in vertebrates. Biol Rev 28:195–244. Axel R (1995) The molecular logic of smell. Sci Am 1273:154–159. Baker H, Franzen L, Stone D, Cho JY, Margolis FL (1995) Expression of tyrosine hydroxylase in the aging, rodent olfactory system. Neurobiol Aging 16:119-128. Benson TE, Ryugo DK, Hinds JW (1984) Effects of sensory deprivation on the developing mouse olfactory system: a light and electron microscopic, morphometric analysis. J Neurosci 4:638–653. Bhatnagar KP, Kennedy RC, Baron G, Greenberg R (1987) Number of mitral cells and bulb volume in the aging human olfactory bulb: a quantitative morphological study. Anat Rec 218:73–87. Brunjes PC (1994) Unilateral naris closure and olfactory system development. Brain Res Rev 19:146–160. Buck L, Axel R (1991) A novel multigene family may encode odorant recognition. Cell 65:175–187. Buck LB (1996) Information coding in the vertebrate olfactory system. Annu Rev Neurosci 19:517–544. Cheng CM, Joncas G, Reinhardt RR, Farrer R, Quarles R, Janssen J, McDonald MP, Crawley JN, Powell-Braxton L, Bondy CA (1998) Biochemical and morphometric analyses show that myelination in the insulin-like growth factor 1 null brain is proportionate to its neuronal composition. J Neurosci 18:5673–5681. Churchill GA, Doerge RW (1994) Empirical threshold values for quantitative trait mapping. Genetics 138:963–971. Coopersmith R, Leon M (1984) Enhanced neural response to familiar olfactory cues. Science 225:849–851. Cremer H, Lange R, Christoph A, Plomann M, Vopper G, Roes J, Brown R, Baldwin S, Kraemer P, Scheff S, et al (1994) Inactivation of the N-CAM gene in mice results in size reduction of the olfactory bulb and deficits in spatial learning. Nature 367:455–459. Darvasi (1998) Experimental strategies for the genetic dissection of complex traits in animals. Nat Gen 18:19–24. Dellovade TL, Pfaff DW, Schwanzel-Fukuda M (1998) Olfactory bulb development is altered in small-eye (Sey) mice. J Comp Neurol 402:402–418. Dietrich WF, Miller JC, Steen RG, Merchant M, Damron D, Nahf R, Gross A, Joyce DC, Wessel M, Dredge RD, et al. (1994) A genetic map of the mouse with 4,006 simple sequence length polymorphisms. Nat Genet. 7:220–245. Finlay BL, Darlington RB (1995) Linked regularities in the development and evolution of the mammalian brain. Science 268:1578–1584. Gheusi G, Cremer H, McLean H, Chazal G, Vincent JD, Lledo PM (2000) Importance of newly generated neurons in the adult olfactory bulb for odor discrimination. Proc Natl Acad Sci USA 97:1823–1828. Gittleman JL (1991) Carnivore olfactory bulb size: allometry, phylogeny and ecology. J Zool Lond 225:253–272. Grisel JE, Belknap JK, O'Toole LA, Wenger CD, Crabbe JC (1997) Quantitative trait loci affecting methamphetamine responses in BXD recombinant inbred mouse strains. J Neurosci 17:745–754. Haley CS and Knott SA (1992) A simple regression method for mapping quantitative trait loci in line crosses using flanking markers. Heredity 69:315–324. Kulkarni A, Airey DC, Williams RW (2000) Genetic architecture of the mouse retinogeniculate system: a QTL analysis of numerical matching. Soc Neurosci Abst 26: in press. Laird PW, Zijderveld A, Linders K, Rudnicki M, Jaenisch R, Berns A (1991) Simplified mammalian DNA isolation procedure. Nucleic Acids Res 19:4293. LaMantia AS; Pomeroy SL; Purves D (1992) Vital imaging of glomeruli in the mouse olfactory bulb. J Neurosci 12:976–988. LaMantia AS; Bhasin N; Rhodes K; Heemskerk J (2000) Mesenchymal/epithelial induction mediates olfactory pathway formation. Neuron in press. Lois C, Alvarez-Buylla A (1994) Long-distance neuronal migration in the adult mammalian brain. Science 264:1145–1148. Love JM, Knight AM, McAleer MA, Todd JA (1990) Towards construction of a high resolution map of the mouse genome using PCR-analyzed microsatellites. Nucleic Acids Res 18:4123–4130. Lu L, Airey DC, Williams RW (2000) Genetic architecture of the mouse hippocampus: Identification of loci with specific effects on hippocampal size. J Neurosci, in rev, <nervenet.org/papers/hipp2000.html> Maruniak JA; Taylor JA; Henegar JR; Williams MB (1989) Unilateral naris closure in adult mice: atrophy of the deprived-side olfactory bulbs. Brain Res Dev 47:27–33. Pennisi E (2000) Mouse sequencers take up the shotgun. Science 287:1179–1181. Pomeroy SL, LaMantia AS; Purves D (1990) Postnatal construction of neural circuitry in the mouse olfactory bulb. J Neurosci 10:1952–1966. Ressler KJ, Sullivan Sl, Buck LB (1994) Information coding in the olfactory system: evidence for a stereotyped and highly organized epitope map in the olfactory bulb. Cell 79:1245–1255. Rikke BA, Johnson TE (1998) Towards the cloning of genes underlying murine QTLs. Mamm Genome 9:963–968. Rosen GD, Williams RW (2000) Stereological and quantitative genetic analysis of the mouse caudate nucleus. Soc Neurosci Abst 26, in press. Rosselli-Austin L, Williams J (1990) Enriched neonatal odor exposure leads to increased numbers of olfacotry bulb mitral and granule cells. Dev Brain Res 51:135–137. Royet JP, Jourdan F, Ploye H, Souchier C (1989) Morphometric modifications associated with early sensory experience in the rat olfactory bulb: II. Stereological study of the population of olfactory glomeruli. J Comp Neurol 289:594–609. Royet JP, Distel H, Hudson R, Gervais (1998) A re-estimation of the number of glomeruli and mitral cells in the olfactory bulb of rabbit. Brain Res 788:35–42. Royet JP; Souchier C; Jourdan F, Ploye H (1988) Morphometric study of the glomerular population in the mouse olfactory bulb: numerical density and size distribution along the rostrocaudal axis. J Comp Neurol 270:559–568. Shepherd GM, Greer CA(1998) Olfactory bulb. In: Shepherd GM, ed. The synaptic organization of the brain, 4th ed. Oxford UP, New York. Sokal RR, Rohlf FJ (1995) Biometry: the principles and practice of statistics in biological research. 3rd Ed. New York: WH Freeman. Strom RC (1999) Genetic analysis of variation in neuron number.Dissertation, University of Tennessee, Memphis. Tomasiewicz H, Ono K, Yee D, Thompson C, Gioridis C, Rutishauser U, Magnuson T (1993) Genetic deletion of a neural cell adhesion molecule variant (N-CAM-180) produces distinct defects in the central nervous system. Neuron 11: 1163–1174. Taylor BA (1989) Recombinant inbred strains. In: Genetic variants and strains of the laboratory mouse 2nd Ed (Lyon ML, Searle AG, eds), pp 773–796. Oxford: Oxford UP. Taylor BA, Wnek C, Kotlus BS, Roemer N, MacTaggart T, Phillip (1999) Genotyping new BXD recombinant inbred mouse strains and comparison of BXD and consensus maps. Mamm Genome 10:335–348. Tropepe V, Craig CG, Morshead DM , van der Kooy D (1997) Transforming growth factor- null and senescent mice show decreased neural progenitor cell proliferation in the forebrain subependmya. J Neurosci 17:7850–7859. van der Kooy D, Weiss S (2000) Why stem cells. Science 287:1439–1442. Vassar R, Chou Sk, Sitcheran R, Nunez JM, Vosshall GL, Axel R (1994) Topographic organization of sensory projections to the olfactory bulb. Cell 74-309–318. Williams RW (1998) Neuroscience meets quantitative genetics: Using morphometric data to map genes that modulate CNS architecture. In: Morrison J, Hof P (eds) Short course in quantitative neuroanatomy. Society of Neuroscience, Washington DC, pp 66—78. Williams RW (2000) Mapping genes that modulate mouse brain development: a quantitative genetic approach. In: Mouse brain development. (Goffinet A, Rakic P, eds), pp 21–49. Berlin: Springer. Williams RW, Strom RC, Rice DS, Goldowitz D (1996) Genetic and environmental control of retinal ganglion cell number in mice. J Neurosci 16: 7193–7205. Williams RW, Strom RC, Goldowitz D (1998) Natural variation in neuron number in mice is linked to a major quantitative trait locus on Chr 11. J Neurosci 18:138–146. Wright S (1978) Evolution and the genetics of populations. Univ Chicago Press. Woo CC, Coopersmith R, Leon M (1987) Localized changes in olfactory bulb morphology associated with early olfactory learning. J Comp Neurol 263:113–125. Yang XW, Wynder C, Doughty ML, Heintz N (1999) BAC-mediated gene-dosage analysis reveals a role for Zipro1 (Ru49/Zfp38) in progenitor cell proliferation in cerebellum and skin. Nat Genet 22:327–335. Zhou G, Williams RW (1999) Eye1 and Eye2: Gene loci that modulate eye size, lens weight, and retinal area in mouse. Invest Ophthalmol Vis Sci 40:817–825.
|

Neurogenetics at University of Tennessee Health Science Center
| Text Only | Top of Page |
Mouse Brain Library | Related Sites | Complextrait.org
