 |
| |||||
|
| ||||||||
|
| ||||||||
Home  Publications Publications |
|
|
Note to the Reader This is an expanded edition of a paper published in Investigative Ophthalmology and Visual Science, April, 1999. The original and definitive print version is available from IOVS. This edition has full in-text citations. Text additions and modifications are delimited by brackets [...]. Chinese Language Version of Abstract Print Friendly Investigative Ophthalmology and Visual Science
40:817–825 (1999) Abstract AbstractVision is critically dependent upon genetic factors that influence the
rate and duration of eye growth. Here we explore the genetic basis of
variation in eye size in mice and specifically map genes that modulate eye
weight, lens weight, and retinal surface area. IntroductionMyopia is a pervasive and extremely common abnormality in modern human
populations (Richler and Bear, 1980; Angle and Wissman, 1980; Baldwin,
1981) that is generally caused by excessive growth of the posterior
segment of the eye relative to the refractive power of the cornea and lens
(Fledelius, 1982, 1992, 1996). The onset and progression of myopia is
strongly influenced by environmental factors, including premature birth (Fledelius,
1981), sustained near vision (Donders, 1864; Dunphy et al., 1968), and
form deprivation (Wiesel and Raviola, 1977; Sherman and Norton, 1977;
O’Leary and Millodot, 1979). However, susceptibility to these factors is
clearly under partial genetic control (Furusho, 1957; Sorsby et al., 1966;
Karlsson, 1974; Basu and Jindal, 1983; Ashton, 1985; Teikari et al., 1991;
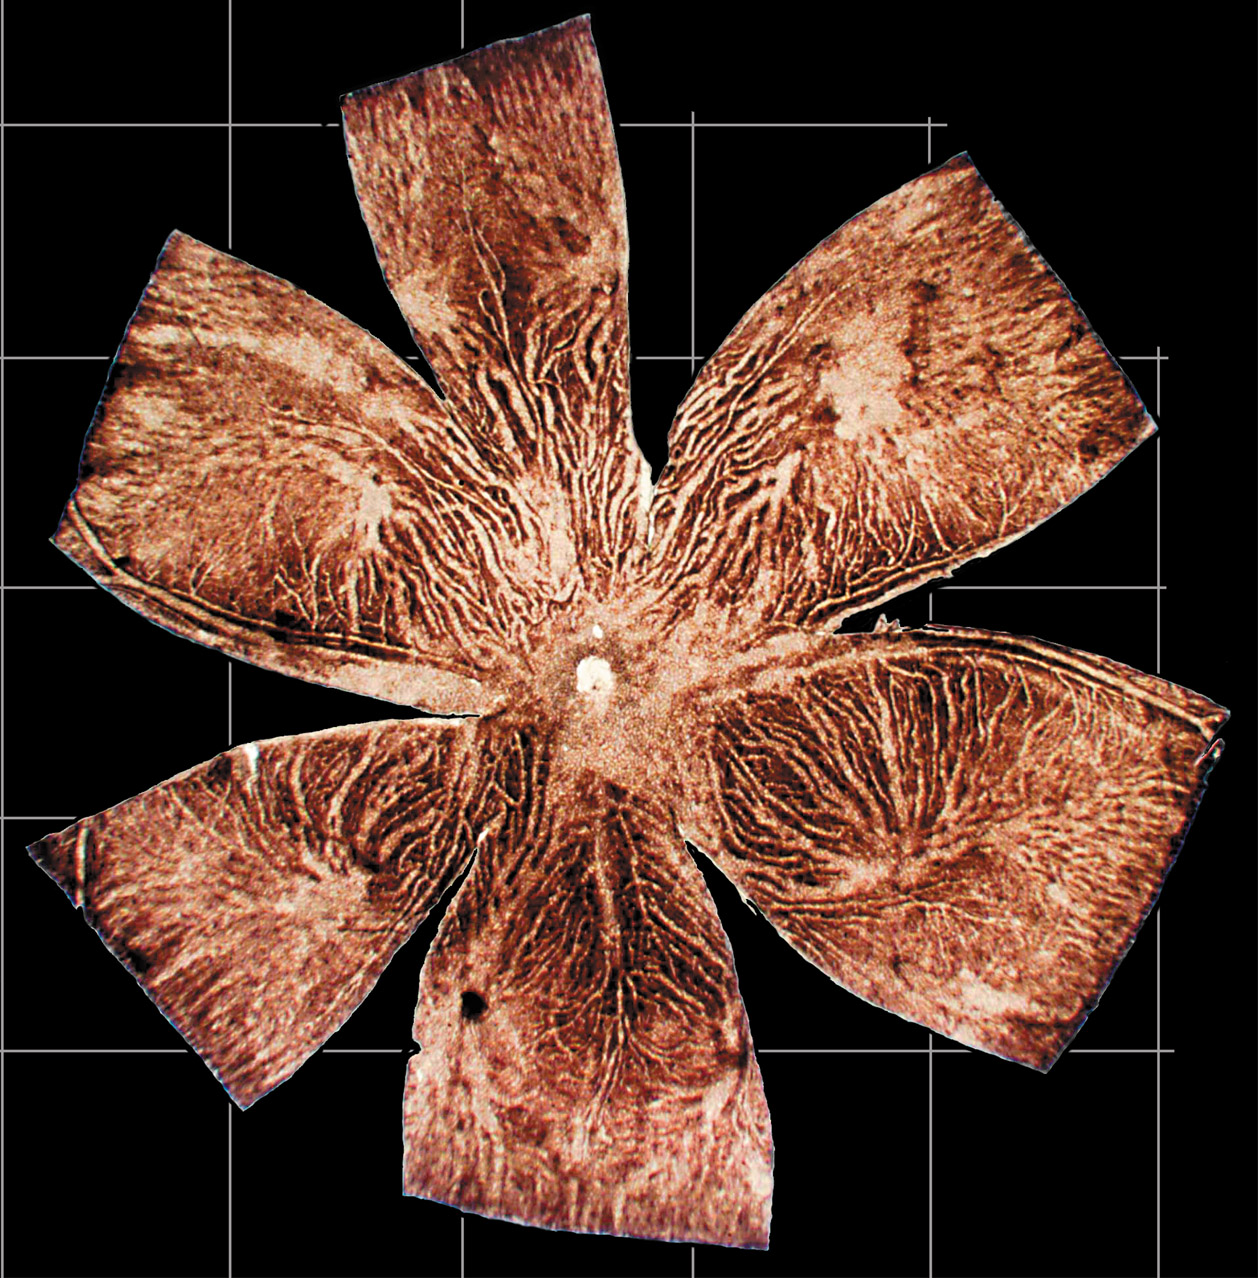
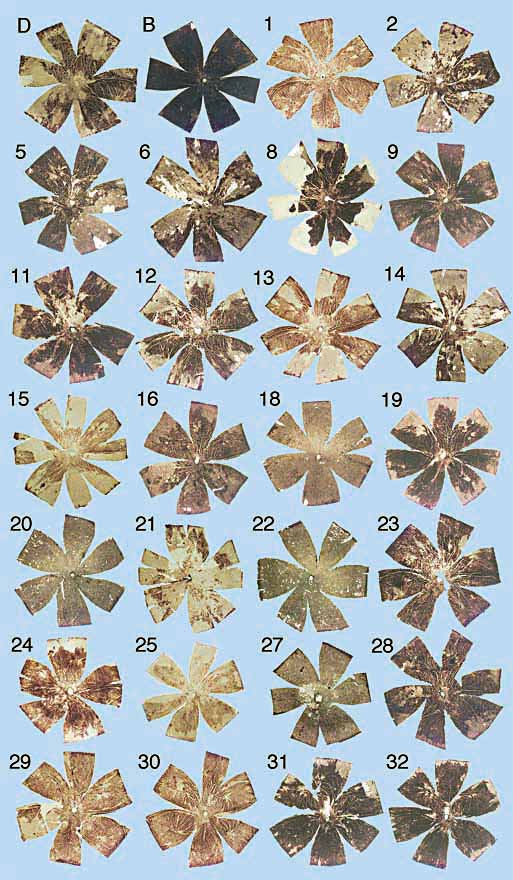
Freund et al., 1996). Materials and MethodsInbred Strains. Inbred strains, including two common strains, C57BL/6J and DBA/2J, and the entire set of 26 BXD recombinant inbred strains, were obtained from the Jackson Laboratory (Bar Harbor, Maine). The BXD strains were generated by Dr. Benjamin Taylor at the Jackson Laboratory (Bar Harbor, ME) by crossing two inbred lines–one of which has a relatively small eye (C57BL/6J) and the other of which has a large eye (DBA/2J) and is also highly susceptible to pigment dispersion—type glaucoma (John et al., 1998). Most BXD strains were bred for several generations in our colony. All experiments were performed in compliance with the ARVO statement for the use of animals in ophthalmic and vision research. F2 Intercross. Female C57BL/6J were mated to male DBA/2J mice to generate B6D2F1hybrids. Female DBA/2J were mated to male C57BL/6J mice to generate the reciprocal D2B6F1 hybrids. F1 hybrids were bred to generate B6D2F2 progeny (n = 107) and D2B6F2 progeny (n = 76). Eyes of all F1 and F2 progeny were dissected and weighed. Husbandry and Age. Mice were maintained at 20–24 °C on a 14/10 h light-dark cycle in a pathogen-free colony. Most animals were fed a 6% fat NIH31 diet at the Jackson Laboratory and a 5% fat Agway Prolab 3000 rat and mouse chow at the University of Tennessee. The average age of BXD animals was approximately 106 days, whereas that of the F2 mice was 98 days. Fixation. Mice were deeply anesthetized with Avertin (1.25% 2,2,2-tribromoethanol and 0.8% tert-pentyl alcohol in water, 0.5-1.0 ml ip). Most mice were perfused through the heart with 0.1 M phosphate buffered saline followed by 1.25% glutaraldehyde and 1.0% paraformaldehyde in 0.1M phosphate buffer, and then by 2.5%glutaradehyde and 2.0% paraformaldehyde in 0.1 M buffer. Fresh versus Fixed Eye Weights. Both eyes of each mouse were removed and the optic nerve, vessels, and muscles were cut away. Eyes were weighed to the nearest 0.1 mg with a repeatability of better than 0.3 mg. We studied eyes taken from eight or more animals from each strain and averaged data from right and left eyes. Eyes of a total of 380 BXD and parental strains were weighed (Table 1). To assess shrinkage caused by fixation and other post-mortem changes, we compared weights of more than 310 fixed and unfixed freshly enucleated eyes from other strains of mice not otherwise described in this paper. One or both eyes were enucleated before being perfused, cleaned, and weighed within minutes. Freshly dissected eyes were subsequently placed in fixative and weighed again 1 h to 5 days later. The weights of fixed eyes–whether perfused or immersion fixed–were generally 6.1% less than those of fresh eyes. The correlation between fresh and fixed eye weights is high (r = 0.96). The majority of eye weights listed in this paper are adjusted to those expected of fresh material immediately after death. Eye weight and linear dimensions. Quantitative genetic studies such as ours require the analysis of comparatively large numbers of animals. The advantage of weighing eyes rather than obtaining a set of linear measurements is that it is easier, faster, and often more accurate; particularly when eyes are as small as those of mice (Fernald and Wright, 1985). Weights that are repeatable to within 1% can be obtained in a minute or less. Differences in eye weight have been used by other investigators as a simple and reliable indicator of eye growth (Scammon et al., 1925; Fledelius and Christensen, 1996). It would clearly be of interest to eventually generate accurate linear measurements of eye dimensions similar to those generated by Kröger and Fernald (1994). Retinal Wholemounts and Lens Weight. Retinal wholemounts were prepared from a subset of 136 cases representing all of the BXD strains and the two parental strains. The cornea was removed and retina was gently separated from the choroid plexus and the ciliary body. Five radial cuts extending 1—2 mm into the retina toward the optic disc were made, and the retina was flattened onto a slide and coverslipped in Gelvatol (see cover illustration; reviewer copy Figure 4). Low-power drawings of retinal wholemounts were traced on a digitizing tablet, and retinal areas were determined with a precision of better than 0.5 mm2. Lens weights were also obtained for a subsample of 122 cases. Mapping Eye Weight QTLs. Simple and composite interval mapping were performed using the program Map Manager QT and a dataset of RI strain genotypes originally compiled by R. W. Elliott and B. Taylor (Williams et al., 1998a; Williams, 1998b, see http://www.nervenet.org/papers/ShortCourse98.html for an introduction to QTL mapping). A non-redundant set of 590 loci that define a genome with a total length of approximately 1640 cM was used for QTL analysis (Williams et al., 1998a). Genome-wide significance was estimated by comparing the peak likelihood ratio statistic (LRS = 4.61 x LOD) of the correctly ordered data with those computed for 20,000 random permutations of the data. Permutations were run using the equations of Churchill and Doerge (1994) implemented by MapManager QT on Macintosh 8600/300 computers. Procedural details are provided in Williams et al. (1998a). An analysis of the permutations allowed us to estimate appropriate genome-wide statistical criteria (Lander and Kruglyak, 1995). Files used for mapping are available at http://www.nervenet.org/neuron.html. Mapping data have been deposited with the Mouse Genome Database. Genotyping. Genomic DNA was extracted from spleen using a high salt procedure (Laird et al., 1991). DNA was amplified by the polymerase chain reaction (PCR) as detailed in Williams and Strom (http://www.nervenet.org/papers/PCR.html). A set of two microsatellite markers on chromosome (Chr) 5 (D5Mit346, D5Mit22) and two markers on Chr 17 (D17Mit21, D17Mit 46) were typed in the parental strains, all BXD RI strains, and the F2 progeny using a modified version of the protocol of Love et al. (1990) and Dietrich et al. (1992). Each 10 µl PCR reaction contained 1X PCR buffer, 1.92 mM MgCl2, 0.25 units of Taq DNA polymerase, 0.2 mM of each deoxynucleotide, 132 nM of the primers and 50 ng of genomic DNA. The microsatellite primer pairs were purchased from Research Genetics, Huntsville, AL. A loading dye (60% sucrose, 1.0 mM cresol red) was added to the reaction before the PCR (Routman et al., 1994). PCRs were carried out in 96-well microtiter plates. We used a high stringency touchdown protocol in which the annealing temperature was lowered progressively from 60 °C to 50 °C in 2 °C steps over the first 6 cycles (Don et al., 1991). After 30 cycles, PCR products were run on 2.5% Metaphor agarose gels (FMC Inc., Rockland ME), stained with ethidium bromide, and photographed. Genotypes were entered into Map Manager QT and Microsoft Excel 98. ResultsEye weights of parental strains. At 75 days of age, the eyes of the parental strains, C57BL/6J and DBA/2J, weigh 18.9 ± 0.2 and 20.2 ± 0.2, respectively. The difference between these strain averages is 1.3 mg (6.5%) and is highly significant (F1, 51= 10.1, p = 0.0026). Eye weights of the reciprocal F1 hybrids—B6D2F1 and D2B6F1—are 20.8 ± 0.3 and 20.6 ± 0.3 mg, respectively, an insignificant difference. The high values in both F1 hybrids suggest that collectively the alleles inherited from the DBA/2J parent are dominant. Relative to body size (Table 1), eyes of these mice are 10 times larger than those of humans (0.1% vs. 0.01% of body weight; Scammon and Armstrong, 1925). Eye size is clearly a crucial parameter in maintaining reasonable sensitivity under scotopic conditions. Effects of Age, Sex, Body Weight, and Brain Weight on Eye Size. Eye weights for all BXD cases were corrected by multiple linear regression analysis to minimize extraneous effects of variation in body weight, brain weight, sex, and age on the eyes (Table 1). Age, sex, body weight, and brain weight collectively accounts for ~57% of the variance in eye weight. The line of best fit is described by the relationship eye weight (fixed in mg) = 1.04 + 5.53 (logarithm of age in days) + 0.066 (body weight in gm) + 0.012 (brain weight in mg) + 0.156 (if female) Using this relationship, the predicted fixed eye weight of a 75-day-old, 22-gm female with a brain weight of 420 mg is 18.0 mg. The final estimate, after correcting for fixation (+6.1%), is 19.1 mg. The logarithm of age is the most important single predictor of eye size in sexually mature mice (p = 0.0001, t-ratio = 10.4). Brain weight (p = 0.0001, t-ratio 5.1) and body weight (p = 0.01, t-ratio 2.6) are also significant predictors in a multiple regression analysis. Once the effect of body weight is factored out, it become apparent that sex has no independent or specific effect on eye weight (p = 0.39). A similar multiple linear regression was used to adjust retinal area and lens weight. Table 1. Eye weight, lens weight, retinal area, and retinal ganglion cell number in BXD strains *
* The column labeled Mean difference gives the difference in
milligrams between the average for a particular strain and the average of
all strains (18.8 mg). Lens weight, retina area, body weight, and brain
weight values are all corrected by multiple linear regression to eliminate
variance associated with sex and age. Data on retinal ganglion cell
numbers (RGC number) are taken from Williams et al., 1998a, and are
corrected variance associated primarily with brain weight. Genotypes are
provided for the Chr 5 locus D5Mit346 and for the Chr 17 locus
D17Mit46.
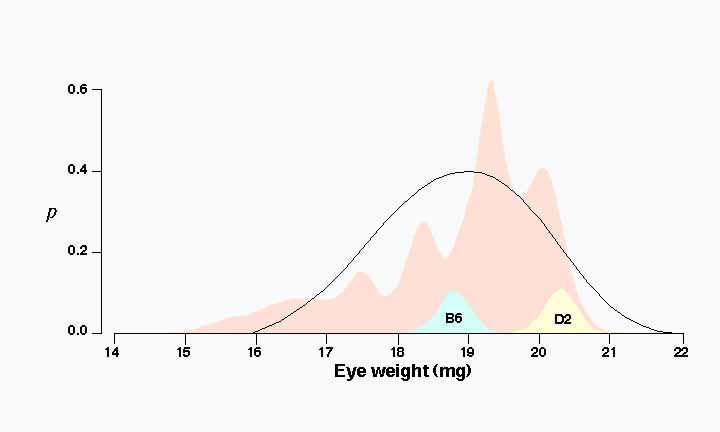
Differences in eye weight among BXD strains. Eye weights of the 26 BXD strains average 18.8 ± 0.3 (mg ± SE) and range from a low of 15.6 mg in BXD21 to a high of 20.2 mg in BXD11. This range extends far below the value of the parental strain C57BL/6J, which has the smaller eye (18.9 mg). Six strains have eye weights significantly less than 18.0 mg. In contrast, none of the BXD strains has an eye weight greater than that of the DBA/2J parent (20.2 mg). Strain means below 18 mg are presumably due to the inheritance of low alleles from both parental strains. This indicates that a small number of loci may have relatively large effects on eye weight. Two major modes. Strain averages are characterized by several prominent modes centered at the values of 17.5, 18.3, 19.4, and 20.1 mg. (Fig. 1). This is illustrated clearly in the probability density distribution in Figure 1 . In essence this figure is a smoothed histogram of average eye weight for all 26 strains. This multimodal distribution suggests that one or more QTLs generate a difference of 1 mg or more among the BXD strains (compare to Fig. 4 of Williams et al., 1996).
Mapping QTLs that Modulate Eye SizeMapping QTLs using the BXD strains is in essence a search for marker loci for which B alleles (inherited from C57BL/6J) and D alleles (inherited from DBA/2J) match up with BXD strains that have low and high eye weights. The methods are reviewed in detail in Williams, 1998b. In our case, an excellent match between variation in eye weight and the pattern of B and D alleles among BXD strains was discovered at the marker D5Mit346 on proximal Chr 5. Figure 2 illustrates this concordance. The Pearson-product moment correlation coefficient between eye weight and alleles at D5Mit346 is 0.78 (Table 1; for purposes of computing correlations, B alleles at Mendelian loci are assigned a value of 0 and D alleles are assigned a value of 1). This suggests that as much as 38% of the genetic variance and 15–20% of the total phenotypic is generated by Eye1. This is probably an overestimate of this QTL’s influence (reviewed by Lynch and Walsh, 1998).
Composite interval mapping to detect additional QTLs. Eye1 is the only QTL defined unambiguously by our dataset by means of simple interval mapping. Composite interval mapping is a refinement on simple interval mapping in which effects of well-mapped QTLs are accounted for while searching for additional loci. This method eliminates variance generated by primary QTLs and allows QTLs with smaller effects to be resolved. When we control for variation generated by Eye1, the best subsidiary locus is located on Chr 17, flanked proximally by D17Pri1 (9.4 cM) and distally by Tpx1 (22 cM), with a peak LRS of 10.0 near Col1a2. Using the BXD strains alone, this interval falls short of the genome-wide significance level needed to declare a QTL, but the region has a sufficiently high LRS statistic (Fig. 3, inset) to suspect that it may harbor a QTL (Lander and Kruglyak, 1995). We subsequently verified the Chr 17 QTL with F2 progeny. This made it possible to control for the Chr 17 interval and reexamine Chr 5 (now using the composite mapping method). The LRS of Eye1 was boosted from 24.9 to 33.9. Controlling for variation associated with the Nnc1 locus on Chr 11—a locus known to modulate numbers of retinal ganglion cells in BXD mice (Williams et al., 1998a)—further strengthens the linkage of Eye1 (LRS 36.8; LOD 8.0).
Analysis of F2 intercrosses between C57BL/6J and DBA/2JA multiple regression analysis that simultaneously takes into account the factors listed in Table 2—age, sex, body weight, brain weight, litter size, parity—explains 43% of the variance among F2 mice. The variable in Table 2 labeled F2 type was used to distinguish between D2B6F2 offspring and B6D2F2 offspring. Members of these reciprocal crosses differ in the genotypes of their sex chromosomes and mitochondria. For example, D2B6F2 females have either a DD or DB genotype at loci on the X chromosome and a D mitochondrial genotype, whereas B6D2F2 females have either a BB or DB genotype and a B mitochondrial genotype. Male mice have different Chr Y and mitochondrial genotypes. Eye weights of these progeny differ by about 0.5 mg—a difference that approaches significance (p = 0.096). In this case, non-autosomal C57BL/6J genotypes are associated with higher mean value.
Table 2. ANOVA and regression analysis of eye weights of F2 intercrosses
r2 (adjusted for multiple factors) = 42.7%
Eye1 and Eye2 verified by the F2 intercross. An
analysis of F2 progeny confirms that Eye1 is tightly linked to
D5Mit346. Individuals with the BB genotype at D5Mit346
have a mean eye weight of 20.06 ± 0.17 mg, whereas individuals with BD
and DD genotypes have eye weights of 20.72 ± 0.09 and 20.74 ± 0.14
mg, respectively. These three genotypes can be readily analyzed using a
single-factor ANOVA, and the result is a highly significant effect of
genotype (F2,180 = 8.5, p = 0.0003) at
D5Mit346. This analysis of the large sample of F2 animals also allowed
us to demonstrate that the D allele at Eye1 is fully
dominant—there is no significant quantitative difference between BD
and DD genotypes. The Pearson-product moment correlation between
eye weight and a dominant model of gene action (BB genotypes scored
as 0, and both BD and DD scored as 1) is 0.26. This allows
us to estimate the size of the effect of Eye1 on eye weight. (The
effects of allele substitutions depend greatly on population structure,
dominance relations among alleles, norms of reaction, and other complex
gene-gene and gene-environment interactions.) A simple analysis of the
difference between mice raised in a uniform environment indicates that
Eye1 is responsible for ~7% of the total phenotypic variance in eye
weight of an age-adjusted population of F2 progeny. The additive effect of
a B-to-D allele substitution is about 0.4 mg. Specificity of ActionFrom the preceding analysis we can say with confidence that Eye1 and Eye2 modulate weight of the eye and that this effect is independent of body weight or brain weight. But using these data we cannot assess whether these loci act selectively on anterior or posterior segments of the eye. To test specificity of gene action, we quantified additional eye traits and examined correlations between these traits and genotypes of markers on Chr 5 (D5Mit346) and Chr 17 (D17Mit46). The traits include total retinal area, lens weight, and retinal ganglion cell numbers for the complete set of BXD strains (Table 3).
Table 3. Specificity of action of Eye1 and Eye2. Correlations among 28 strains
*A single asterisk marks correlations significantly above 0 with 25 degrees of freedom at p < 0.05.
A final question is whether Eye1 or Eye2 have selective effects one any specific ocular components when we correct for difference in eye weight. In other words, does either locus have a greater effect on lens or retina, than on the eye as a whole? This question can be addressed by using multiple regression to control for differences in eye weight. There are many interesting ways to perform the multiple regression analysis and key data for 28 strains are provided in Table 1. One can, for example, determine the coefficient of the highly significant relationship between retinal area and lens weight. With respect to selectivity ofEye1 and Eye2: neither QTL has selective effects on retinal area or retinal ganglion cell number. However, when we correct for the derived variable eye weight – lens weight, then Eye1 has a significant selective effect on lens weight (p = 0.03, +0.21 mg/D allele). In contrast, Eye2 does not have a selective effect on the lens that we can detect.
DiscussionSynopsis. We have mapped two quantitative trait loci that have pronounced effects on eye weight, lens weight, and retinal area to intervals on chromosomes 5 and 17 in mouse. Eye1 and Eye2 are the first QTLs in any vertebrate that has been shown to modulate normal variation in eye size. This work is important for two reasons: first, it represents a key step in characterizing genes that normally modulate growth of the eye. Second, our discovery raises the possibility that a human counterpart of the Eye1 gene is located on the long arm of chromosome 7—the homologous chromosomal segment in humans. A homolog for Eye2 should map to human 16q13.3, 6p21, or 21q22.3. These loci may also control normal eye growth in humans and may also influence susceptibility to the development of myopia, and possibly even glaucoma. A new model to study the genetic basis of human myopia. Many of
the most serious eye pathologies that afflict humans have murine
counterparts that have proved to be useful in understanding disease
etiology and, in some instances, in developing treatments. Despite its
prevalence and huge cumulative cost to society, myopia is a notable
exception, and murine experimental systems have not yet been developed.
One reason is that research on myopia is well served by sophisticated
primate and bird models (Wiesel and Raviola, 1977; Hung et al., 1995;
Marsh-Tootle and Norton, 1989; Siegwart and Norton, 1993; Wallman et al.,
1978). However, complementary genetic models are now needed. It is evident
that susceptibility to myopia is under partial genetic control (Waardenburg,
1963; Sorsby et al., 1966; Karlsson, 1974, 1975; Basu and Jindal, 1983;
Teikari et al., 1991; Freund et al., 1996). Heritability estimates for
myopia in humans are typically above 25%, and we have found that
heritability in mice is roughly 50%. As we have demonstrated, the mouse
can be especially useful in dissecting the genetic mechanisms that
modulate eye growth. Many of the fundamental molecular and cellular
processes that control eye growth are likely to be shared among mammals,
regardless of the reliance that they place on vision. A candidate gene for Eye1. Eye1 is tightly linked to the hepatic growth factor (Hgf) gene on proximal Chr 5 (Lee et al., 1993). Hepatic growth factor is a secreted protein with an unusually broad range of action mediated through the c-Met tyrosine kinase receptor (Rosen et al., 1994). Once cleaved by plasminogen activator and reassembled as an ab dimer, HGF stimulates the division, migration, differentiation, and survival of numerous types of cell, including neural crest, CNS cells, the retinal pigment epithelium, and corneal epithelial cells (e.g., Andermarcher et al., 1996). HGF has also been shown to have an important role as neurotropic and neurotrophic factors in the developing nervous system (Jung et al., 1994; Ebens et al., 1996). In the past year there has been a surge in interest in the role of Hgf in eye research (McBain et al., 1998; Lashkari et al., 1998; Kano et al., 1998). HGF and its receptor are expressed by the retinal pigment epithelium in fetuses and adults (Hinton et al., 1998). In humans, HGF is also secreted by Müller glial cells into the vitreous, and titers are upregulated in patients with diabetic retinopathy (Ikeda et al., 1998). Clearly, allelic variants at the Hgf gene could play a critical role in mice or human. Inactivating the HGF gene by homologous recombination causes mice to die in utero at an early stage (Bladt et al., 1995; Schmidt et al., 1995; Uehara et al., 1995), but it is possible that normal allelic variants in the Hgf gene produce variation in eye size. It should be possible to test the role of Hgf by carefully studying eyes of Hgf transgenic mice (Takayama et al., 1996). Approaching this problem from a different angle, it should be feasible to map Eye1 to within 1-cM using an advanced intercross or with a set of congenic strains straddling the critical interval on Chr 5. Candidate genes for Eye2. Eye2 is linked to a region (10–22 cM) that overlaps the H2 histocompatibility complex. This interval harbors several interesting candidates, particularly peripherin 2 (Prph2 at 18.8 cM) and a retinoid X receptor (Rxrb at 18.5 cM). The Rd2 (or rds) mutation in peripherin 2 (Connell et al., 1991) causes retinitis pigmentosa in both mouse and human. Relatively subtle changes in retinal activity can have marked effects on eye size (Wiesel and Raviola, 1977; Sherman and Norton, 1977; Wallman et al., 1978; Kröger and Fernald, 1994), and it is conceivable that allelic variants of peripherin exert indirect effects on eye growth. Rxrg is a zinc-finger nuclear transcription factor expressed ubiquitously early in mouse development (Dollé et al., 1994). Retinoic acid receptors are known to modulate the weight of the eye and the area of the retina (Zhou et al., 1998). Other QTLs affecting eye growth. Eye1 and Eye2 are just two of many polygenes that influence the rate and duration of eye growth in mouse. Our analysis indicates that these loci account for approximately 10% of the total phenotypic variance in eye weight in the particular cross that we used. Given that more than 10,000 genes are expressed in the mammalian eye during development (Williams et al., 1998b), there are almost certainly a substantial number of additional polymorphic genes that contribute to normal genetic variation in eye growth. Eye size and glaucoma. A hallmark of glaucoma is an increase in
intraocular pressure (IOP) that can in some instances be associated with
an increase in eye size. We initially assumed that variation in eye weight
among mice is an expression of normal variation and that the modest
difference between the parental strains C57BL/6J and DBA/2J was not
related to any pathology. However, recent work by John and colleagues
(1998) calls this assumption into question. They have demonstrated that
DBA/2J mice develop severe pigment dispersion-type glaucoma after 1 year
of age. This discovery is particularly important to us because DBA/2J is
one of the parental strains that we used in our mapping study. Almost all
of mice that we examined were young asymptomatic adults (<4 months old);
it is nevertheless possible that Eye1 contributes not only to their
larger eye size, but to their eventual progression to glaucoma, perhaps as
one of several susceptibility genes. AcknowledgementsThis research was supported by grant EY06627 from the National Eye
Institute. We thank Xiyun Peng for genotyping F2 animals and RI strains
and Xiaoyu Zhou for data entry. We thank Kathryn Graehl for editing this
paper. References
Andermarcher E; Surani MA; Gherardi E (1996) Co-expression of the HGF/SF and c-met genes during early mouse embryogenesis precedes reciprocal expression in adjacent tissues during organogenesis. Dev Genet 18:254–266. Andersen JS, Pralea AM, DelBono EA, Haines JL, Gorin MB, Schuman JS, Mattox CG, Wiggs JL (1997) A gene responsible for the pigment dispersion syndrome maps to chromosome 7q35–q36. Arch Ophthalmol 115:384-388. Angle J, Wissman DA (1980) The epidemiology of myopia. Am J Epidem 111:220–228. Ashton GC (1985) Segregation analysis of ocular refraction and myopia. Hum Hered 35:232–239. Baldwin WR (1981) A review of statistical studies of relations between myopia and ethnic, behaviroal and physiological characteristics. Am J Optom Physiol Optics 58:516–527. Bladt F, Rietmacher D, Isenmann S, Aguzzi A, Birchmeier C (1995) Essential role for the c-met receptor in the migration of myogenic precursor cells into the limb bud. Nature 376:768–771. Basu SK, Jindal A (1983) Genetic aspects of myopia among the Shia Muslim Dawoodi Bohras of Udaipur, Rajsthan. Hum Hered 31:199–200. Cheverud J, Routman E, Duarte FM, van Swinderen K, Cothran K, Perel C (1996) Quantitative trait loci for murine growth. Genetics 142:1305–1319. Connell G, Bascom R, Molday L, Reid D, McInnes RR, Molday RS (1991) Photoreceptor peripherin is the normal product of the gene responsible for retinal degeneration in the rds mouse. Proc Natl Acad Sci USA 88:723–726. Curtin BJ (1985) The etiology of myopia. In The Myopias:pp.51–52. Harper and Row: Philadelphia. Dawkins R (1996) Climbing Mount Improbable. WW Norton, London. Denis D, Righini M, Scheiner C, Volot F, Boubli L, Dezard X, et al. (1993) Ocular growth in the fetus. 1. comparative study of axial length and other biometric parameters in the fetus. Opthalmologica 207:117–124. Dietrich WF, Katz H, Lincoln SE, Shin H, Friedman J, Dracopoli NC, Lander ES (1992) A genetic map of the mouse suitable for typing in intraspecific crosses. Genetics 131: 423–447. Dietrich WF, Miller J, Steen R, Merchant MA, Damron-Boles D, Husain Z, Dredge R, Daly MJ, Ingalls KA, O'Connor TJ, et al (1996) A comprehensive genetic map of the mouse genome. Nature 380:149-52. Dollé P, Fraulob W, Kastner P, Chambon P (1994) Developmental expression of murine retinoid X receptor (RXR) genes. Mech Devel 45:91–104. Donders FC (1864) On the anomalies of accommodation and refraction of the eye with a preliminary essay on physiological dioptrics. Moore WD, translation. London: New Syndenham Society. Dunphy EB, Stoll MR, King SH (1968) Myopia among American male graduate students. Amer J Ophthalmol 65:518–521. Ebens A, Brose K, Leonardo ED, Hanson MG Jr, Bladt F, Birchmeier C, Barres BA, Tessier-Lavigne M (1996) Hepatocyte growth factor/scatter factor is an axonal chemoattractant and a neurotrophic factor for spinal motor neurons.Neuron 17:1157–1172. Fernald RD, Wright SE (1985) Growth of the visual system in the African cichlid fish Haplochromis burtoni. Accommodation. Vision Res 25:163–170. Fischer AJ, Miethke P, Morgan IG, Stell WK (1998) Retinal sources of acetylcholine (Ach) do not participate in visually guided ocular growth or atropine-mediated suppression of form–deprivion myopia (FDM). Invest Ophthamol Vis Sci Suppl 39: 717 Fledelius HC, Christensen AC (1996) Reappraisal of the human ocular growth curve in fetal life, infancy, and early childhood. Brit J. Ophthalmol 80:918–921. Freund C, Horsford DJ, McInnes RR (1996) Transcription factor genes and the developing eye: a genetic perspective. Hum Mol Gen 5:1471–1488. Furusho T (1957) Studies on the genetic mechanism of short-sightedness. Jap J Ophthalmol 1:185–190. Glickstein M, Millodot M (1970) Retinoscopy and eye size. Science 168:605–606. Graw J (1996) Genetic aspects of embryonic eye development in vertebrates. Devel Genet 18:181–197. Haldane JBS, Sprunt AD, Haldane NM (1915) Reduplication in mice, J Genet 5:133–135. Harding JJ, Rixon KC, Marriott FHC(1977) Men have heavier lenses than women of the same age. Exp Eye Res. 25: 651 Hiller-Adams P, Case JF (1988) Eye size of pelagic crustaceans as a function of habitat depth and possession of photophores. Vis Res 28:667–680. Hiller-Adams P, Case JF (1994) Optical parameters of euphausiid eyes as a function of habitat depth. J Comp Physiol 154:307–318. Hinton DR, He PM, Ryan SJ, He S (1998) Retinal pigment epithelial cells secrete and respond to hepatocyte growth factor. Invest Ophthamol Vis Sci Suppl 39:733. Hirsch MJ (1952) The changes in refraction between the ages of 5 and 14. Amer J Ophthal 29:445–459. Holm E (1926) Myopia from the point of view of heredity. Acat Opthalmol (Copenh) 3:335–347. Hughes A (1979) A schematic eye for the rat. Vision Res 19:569–588. Hung LF, Crawford MLJ, Smith EL (1995) Spectacle lenses alter eye growth and the refractive status of young monkeys. Nature Med 1:761–765. Ikeda T, Nishimura M, Ushiyama M, Ohtsuka K, Yoshimura M, Kinoshita S, Puro DG (1998) Vitreous levels of human hepatocyte growth factor increase in proliferative diabetic retinopathy. Invest Ophthalmol Vis Sci Suppl 39:124 Isenberg JJ, Neumann D, Cheong PYY, Ling YLF, McCall LC, Ziffer AJ (1995) Growth of the internal and external eye in term and preterm infants. Ophthalmology 102:827–830. John SWM, Hagaman JR, MacTaggart TE, Peng, L, Smithes O (1997) Intraocular pressure in inbred mouse strains. Invest Ophthamol Vis Sci 38:249–253. John SWM, Richard SS, Olga VS, et al. (1998) Essential iris atrophy, pigment dispersion, and glaucoma in DBA/2J mice. Invest Ophthamol Vis Sci 39:951–962. Jung W, Castern E, Odenthal M, VandeWoude GF, Ishii T, Dienes GP, Lindholm D, Schirmacher P (1994) Expression and functional interaction of hepatocyte growth factor and its receptor c-met in mammalian brain. J Cell Biol 126:485–494. Kano Y, Yanagihara N, Moriwaki M, Komatsu T, Yasunari T, Shiraki K, Miki T, Ontani S (1998) Hepatocyte growth factor induces proliferation and morphogenesis of cultured retinal pigment epithelium. Invest Ophthamol Vis Sci Suppl 39:733. Karlsson JL (1974) Concordance rates for myopia in twins. Clin Genet 6:142–146. Karlsson JL (1975) Evidence for recessive inheritance of myopia. Clin Genet 7:197–202. Kröger RHH, Fernald RD (1994) Regulation of eye growth in the African cichlid fish, Haplorchromis burtoni. Vis Res 34: 1807–1814. Laird PW, Zijderveld A, Linders K, Rudnicki M, Jaenisch R and Berns A (1991) Simplified mammalian DNA isolation procedure. Nucleic Acids Research 19:4293. Lander ES, Schork NJ (1994) Genetic dissection of complex traits. Science 265:2037–2048. Lander ES, Kruglyak L (1995) Genetic dissection of complex traits: guidelines for interpreting and reporting linkage results. Nat Genet 11:241–247. Lashkari K, Rahimi N, Kazlauskas A (1998) Hepatocyte growth factor is a potent mitogen and motogen in human retinal pigment epithelial cells. Invest Ophthalmol Vis Sci 39:579. Latimer HB (1938) The prenatal growth of the cat. VII. The growth of the brain and of its parts, of the spinal cort and of the eyeballs. J Comp Neurol 68:381–394. Lee CC; Kozak CA; Yamada KM (1993) Structure, genetic mapping, and expression of the mouse Hgf/scatter factor gene. Cell Adhes Commun 1:101-111. Love JM, Knight AM, McAleer MA, Todd JA (1990) Towards construction of a high resolution map of the mouse genome using PCR-analysed microsatellites. Nucleic Acids Research 18:4123-4130. Lynch M, Walsh B (1998) Genetics and analysis of quantitative traits. Sinauer, Sunderland MA. Marsh-Tootle WL, Norton TT (1989) Refractive and structural measures of lid-suture myopia in tree shew. Invest Ophthalmol Vis Sci 30:2245–2257. McBain VA, Forrester JV, McCaig CD (1998) Effects of hepatocyte growth factor (HGF), karatinocyte growth factor (KGF) and electric fields on bovine corneal epithelial cells. Invest Ophthamol Vis Sci Suppl 39:1039. Murphy CJ, Howland HC (1987) The optics of comparative ophthalmoscopy. Visioin Res 27:599–607. Mutti DO, Ver Hoeve JN, Zadnik K, Murphy CJ (1997) The artifact of retinoscopy revisited: a comparion of refractive error measured by retinoscopy and VEP in the rat. Optom Vis Sci 74:483–488. O'Leary DJ, Millodot M (1979) Eyelid closure causes myopia in humans. Experientia 35:1478–1479. Richler A, Bear JC (1980) The distribution of refraction in three isolated communities in Western Newfoundland. Am J Optom Physiol Optics 57:861–871. Rosen EM, Nigam SK, Goldberg ID (1994) Scatter factor and the c-Met receptor: a paradigm for mesenchymal/epithelial interaction. J Cell Biol 127:1783–1787. Saccone S, Narsimhan RP, Gaudino G, Dalpra L, Comoglio PM, Della Valle G (1992) Regional mapping of the human hepatocyte growth factor (HGF)-scatter factor gene to chromosome 7q21.1. Genomics 13: 912–914. Scammon RE and Armstrong EL (1925) On the growth of the human eyeball and optic nerve. J Comp Neurol 38:165–219. Selther RLP, Stell WK (1995) The effect of VIP on development of form deprivation myopia in the chick: a pharmacological and immunocytochemical study. Vis Res 35:1265–1270. Sherman SM, Norton TT (1977) Myopia in the lid-sutured free shrew (Tupaia glis). Brain Res 124:154–157. Siegwart JT, Norton TT (1993) Refractivve and ocular changes in tree shrews raised with plus or minus lenses. Invest Ophthalmol Vis Sci 34:1208–12XX. Schmidt C, Bladt F, Goedecke S, Brinkmann V, Zschiesche W, Sharpe M, Gherardi E, Birchmeier C (1995) Scatter factor/hepatocyte growth factor is essential for liver development. Nature 373:699–702. Sonnenberg E Meyer D; Weidner KM; Birchmeier C (1993) Scatter factor/hepatocyte growth factor and its receptor, the c-met tyrosine kinase, can mediate a signal exchange between mesenchyme and epithelia during mouse development. J Cell Biol 123: 223–235. Sorsby A, Leary GA, Fraser GR (1966) Family studies on ocular refraction and its components. J Med Genet 3:269–273. Sterling P (1998) The retina. In Synaptic Organization of the Brain, 4th ed (Shepherd GM, ed) pp 205–253. Stone EM, Fingert JH, Alward WLM, Nguyer TD, Polansky JR, Sunden SLF, Nishimura D, Clark AF, Nystuen A, Nicheols BE, Mackey DA, Ritch R, Kalenak JW, Craven ER, Sheffield VC (1997) Identification of a gene that causes primary open angle glaucoma. Science 275:668–670. Stone RA, Laties AM, Raviola E, Wiesel TN (1988) Increase in retinal vasoactive intestinal polypeptide after eyelid fusion in primates. PNAS 85:257–260. Stone RA, Lin T, Laties AM (1991) Muscannic antagonist effects on experimental chick myopia. Exp Eye Res 52:755–758. Takayama H; La Rochelle WJ; Anver M; Bockman DE; Merlin G(1996) Scatter factor/hepatocyte growth factor as a regulator of skeletal muscle and neural crest development., Proc Natl Acad Sci U S A 93:5866-5871. Taylor B (1978) In: Origins of inbred mice (ed. Morse H), pp423–438. New York: Academic Press Uehara Y, Minoa O, Mori C, Shiota K, Kuno J, Noda T, Kitamura N (1995) Placental defect and embryonic lethality in mice lacking hepatocyte growth factor/scatter factor. Nature 373:702–705. Tanksley SD (1993) Mapping polygenes. Annu Rev Genet 27:205–233. Teikari JM, O'Donnell J, Kaprio J, Koskenvuo M (1991) Impact of heredity in myopia. Hum Hered 4:151–156. Mono and dizygotic twin analysis. Heritability was 0.58 Troilo D, Wallman J (1991) Thre regulation of eye growth and refractive stage: an experimetnal study of emmetropization. Vis Res 31:1237–1250. Wallman J, Turkel J, Trachtman J (1978) Extreme myopia produced by modest change in early visual experience. Science 201:1249–1251. Wiesel TN, Raviola E (1977) Myopia and eye enlargement after neonatal lid fusion in monkeys. Nature 266:66–68. Wildsoet CF, Pettigrew JD (1988) Kainic acid-induced eye enlargement in chickens: differential effects on anterior and posterior segments. Invest Ophthalmol Vis Sci 29:311–319. Wilkens H (1971) Genetic interpretation of regressive evolutionary processes: Studies on hybrid eyes of two Astyanax cave populations (Characidae, Pisces). Evolution 25:530–544. Williams RW, Strom RC, Rice DS, Goldowitz D (1996) Genetic and environmental control of variation in retinal ganglion cell number in mice. J Neurosci 16:7193–7205. Williams RW, Strom RC, Goldowitz D (1998a) Natural variation in neuron number in mice is linked to a major quantitative trait locus on Chr 11. J Neurosci 18:138–146. Williams RW, Strom RC, Zhou G, Yan Z (1998b) Genetic dissection of retinal development. Semin Cell Dev Biol 9:249–255. Williams RW, Holdener B, Angel JM, Oakey R, Hunter KW (1998c) Mouse chromosome 7. Mamm Genome 8:S136–159. Williams RW (1998) Neuroscience meets quantitative genetics: using morphometric data to map genes that modulate CNS architecture. The 1998 Short Course in Quantitative Neuroanatomy (Morisson J, Hof P, eds) pp. 66–78. Washington: Society for Neuroscience. (http://www.nervenet.org/papers/ShortCourse98.html). Wold KC (1949) Hereditary myopia. Arch Ophthalmol 42:225–237. Zhou G, Williams RW (1997) Mapping genes that control variation in eye weight, retinal area, and retinal cell density. Soc. Neurosci Abstr 23: 864. Zhou G, Williams RW (1999) Mouse models for the analysis of myopia: variation in eye and lens size of adult mice. Optometry and Vision Science 76:408–418. http://www.nervenet.org/papers/OVSMyopia.html). Zhou G, Strom RC, Giguere V, Williams RW (1998) Modulation of retinal cell populations and eye size in retinoic acid receptor knockout mice. Soc Neurosci Abst 24:in press.
GENETIC CONTROL OF EYE SIZE: A NOVEL QUANTITATIVE GENETIC APPROACH
R. W. Williams and G. Zhou
Purpose: We are using a forward genetic approach to map
genes that modulate eye growth and that may also control susceptibility to
myopia (see
<nervenet.org>). Previously we mapped genes in mouse that have
quantitative effects on eye size (quantitative trait loci or QTLs) to
chromosome (Chr) 5 near the hepatic growth factor gene (the Eye1
locus), and to Chr 17 near the Collla2/Stickler Type II gene (Eye2).
Here we extend this work and map three new QTLs that modulate eye size.
Since 11 August 98
|
Neurogenetics at University of Tennessee Health Science Center
| Print Friendly | Top of Page |
Mouse Brain Library | Related Sites | Complextrait.org
