 |
| |||||
|
| ||||||||
|
| ||||||||
Home  Publications Publications |
|
|
Note to the Reader Please cite this work as: Williams RW, Gu J, Qi S, Lu L (2001) The genetic structure of recombinant inbred mice: High-resolution consensus maps for complex trait analysis. Genome Biology in press. This preprint accompanies the BXN RI dataset, release 1 of January 15, 2001
Print Friendly Proc. Natl. Acad. Sci.
USA 82:3906—3910 (1985) (retinotopic projection / growth cone / retinal ganglion
cell axon / primate embryo) The mechanisms that give rise to topographic connections between
distant groups of neurons in the central nervous system remain an enigma
despite several decades of intense research. One simple hypothesis to
explain the formation of topographic connections is that axons of
neighboring neurons keep in constant contact with each other as they
grow toward their targets (Sperry, 1943; Meinertzhagen, 1976; Horder and
Martin, 1978; Bodick and Levinthal, 1980; Bunt and Horder, 1983). By
growing in tight formation from start to finish the axons could
establish a congruent set of connections. In support of this idea,
several studies have shown a remarkable degree of topographic order
along the entire pathway linking the eye and the brain in a variety of
species (Meinertzhagen, 1976; Scholes, 1979; Bunt and Horder, 1983). Results in other species, however, appear inconsistent with this
simple explanation. For instance, in adult cats and monkeys, axons that
originate from adjacent retinal ganglion cells are often scattered
widely in the optic nerve and tract, and topographic order is either
lost or seriously degraded (Hubel and Wiesel, 1960; Hoyt and Luis, 1962;
Horton et al., 1979; Torrealba et al., 1982; Voigt et al., 1983).
However, because these studies were based on adult animals, it is
possible that the scatter of axons–particularly of those axons that
originate from the older, central part of the retina–occurs only after
the projections have formed. The intrusion of vascular channels, the
proliferation of oligodendrocytes, or the process of myelination may
split apart retinotopically related fibers and account for the
meandering paths taken by numerous axons in mature animals. In the present study we have determined whether the precise
point-to-point connections between the retina and the brain–undoubtedly,
an important determinant of the extraordinary visual capacity of
primates–depends on highly ordered patterns of axonal growth. To do this
at the level of individual axons and growth cones has required an
analysis of consecutive electron micrographs from serial sections
through a segment of the optic nerve. METHODS Tissue Preparation. This study is based on an analysis of an
optic nerve taken from a rhesus monkey (Macaca mulatta) on
the 39th day of the 165-day gestational period. The embryo had a
crown-to-rump length of 19 mm. The embryo was removed by cesarean
section and perfused through the heart with 1.0% glutaraldehyde/1.25%
paraformaldehyde in 0.1 M sodium phosphate buffer, pH 7.4. A series of
500 consecutive transverse ultrathin sections was cut from a 50-µm
segment of the stalk located 0.25—0.30 mm from the back of the eye.
Fifteen sections were lost during sectioning, and the largest single gap
in the series was 6 sections. Mean section thickness was estimated to be
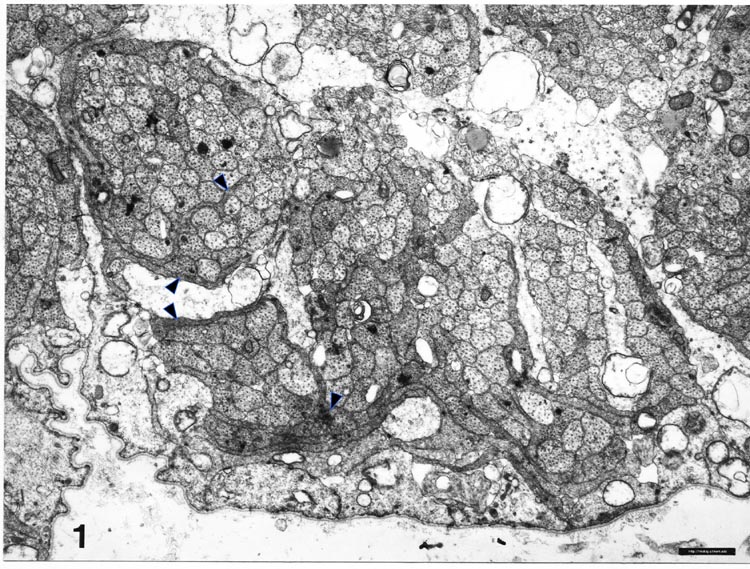
0.1 µm. Tracing and Analysis of Fibers. Electron micrographs were
taken of several interweaving fascicles of fibers located near a
prominent landmark–the embryonic fissure (Fig. 1). Each micrograph
covered a field 12.6 µm x 15.4 µm at x15,500. All axons and growth cones
were arbitrarily assigned a number in the first micrograph of the series
(Figs. 2 and 3A) and were traced sequentially through the series at
intervals of 0.1—0.5. Approximately 24,000 fiber profiles were labeled
on a set of 115 micrographs with fine-tipped marking pens. In total, 189
axons and 40 growth cones were traced in this manner. Of this sample, we
were able to analyze the neighbor relationships of 160 axons and 25
growth cones that were confined to the field covered by the set of
micrographs and for which all neighbors were identified. Neighbor
relationships were assessed in detail at 9 equidistant points through
the series. To accomplish this, approximately 10,000 contacts between
adjacent fibers were recorded and compared. Contacts between fibers and
processes of glial precursors were examined and recorded but were
otherwise not included in the analysis. The perimeter and area of every
fiber in the nerve (n = 8200) were measured by using a digitizing
tablet connected to a computer. The groups of fibers that were examined
in detail did not differ in size or ultrastructure from the entire
population. Even a small number of errors in the identification of fibers would
have serious cumulative effects and would degrade the validity of the
results. To correctly identify fibers we examined several of their
characteristics and double-checked the results. The position of a fiber
was an important identifying feature. Because the average diameter of
axons (0.52 µm) was 5 times the section thickness, their positions
changed almost imperceptibly between adjacent sections. In fact, over
distances of up to 1 µm, fibers could usually be identified reliably by
position alone. The cross-sectional shape and relative size of fibers
were also stable over a distance of at least 0.5 µm, and these features
were also used to identify fibers. Finally, the arrangement and density
of organelles, particularly microtubules and microfilaments, were also
useful in confirming a fiber’s identity. Those fibers that could not be
traced confidently or for which some neighbors were not identified were
not included in the analysis (n = 29). RESULTS Optic Stalk. On the 39th day of gestation, the precursor of
the optic nerve–the optic stalk–is composed of a 40- to
60-µm-thick wall of glial precursors and retinal ganglion cell axons
(Fig. 1). The lumen of the stalk is still continuous with the optic
recess of the third cerebral ventricle. The sections of the optic stalk
that we examined contained a total of 8200 axons and growth cones,
located almost exclusively in the ventral half of the stalk (Fig. 1).
This is only 0.25% of the peak of nearly 3 million fibers reached
at midgestation (Rakic and Riley, 1983). Fascicles. There were 125 fascicles in the stalk. They
contained an average of 66 fibers. Neighboring fascicles were separated
from one another by thin pale processes of glial precursor cells (Fig.
2). The frequency with which fascicles merged and split was remarkable.
Groups of axons and even isolated fibers split off from fascicles,
passed between glial processes, and merged with fibers in neighboring
fascicles. Even over a distance of merely 10 µm, the size, shape, and
fiber composition of most fascicles changed radically.
All fascicles at this age contained growth cones. From this
observation alone we conclude that in primates the number of fibers
increases in all fascicles rather than just in a peripheral subset as
appears to be the case in birds (Rager, 1980). However, fascicles close
to the edge of the nerve usually contained 2 to 4 times more growth
cones than did most fascicles located closer to the center of the stalk.
Fig. 2. Electron micrograph of axons and growth cones in a
fascicle close to the embryonic fissure. Glial processes have a very
light cytoplasm. Axons have a darker cytoplasm. Growth cones sectioned
through their lamellipodia (arrow heads) have dark cytoplasm and
elaborate shapes. Several growth cones are situated between fascicles
and glial processes. A schematic drawing of this field of fibers, in
which all growth cones and growth cone shanks have been identified, is
shown in the central part of Fig. 4A. The ventral surface of the
optic stalk, covered by a basement membrane, is located at the bottom of
the figure. (Bar represents 1 µm.)
Growth Cones. Growing retinal ganglion cell axons have
elaborate growth cones at their tips. Complete three-dimensional
reconstructions of growth cones in the primate optic stalk (Williams and
Rakic, 1984) have shown that most are 30—50 µm long and have several
broad but very thin lamellipodia (Fig. 2). Growth cones had larger perimeters and generally contained a higher
density of microfilaments than did axons. Most growth cones were
situated at the margins of fascicles, between glial processes and other
fibers (Fig. 2). It has been suggested that growth cones of retinal
ganglion cells may adhere preferentially to the basement membrane as
they grow out of the eye and through the nerve (reviewed in Easter et
al., 1984). In the rhesus monkey we have found no evidence of such a
pathway preference. Not a single growth cone grew next to the basement
membrane in either the retina (Williams and Rakic, 1985) or the optic
stalk. Size of Fibers in Relation to Number of Neighbors. The
perimeters of axons ranged from 0.7 to 3.2 µm, with an average of 1.5
µm. In comparison, the perimeters of growth cones averaged slightly more
than 3 times as much (4.7 µm). Axons had an average of 5.3 immediate
neighboring fibers in single transverse sections, while, despite their
greater perimeters, growth cones had a mean of only 7.9 neighbors per
section–merely 50% more than the smallest axons. This small increment in
the number of neighbors, despite a 3-fold increase in surface area, is
due to the fact that growth cones tend to cluster at the margins of
fascicles. As a result, approximately two-thirds of their surface is
apposed to glial cells and the flat surfaces of other growth cones. Instability of Neighbor Relationships. Growth cones and
axons typically lost half of their initial set of neighbors over a
distance of only 8—10 µm. This loss was progressive (Fig. 3). The tips
and shanks of 17 out of 25 growth cones did not have any neighbors in
common, even though these regions were often separated by less than 30
µm. Likewise, out of 465 pairs of contacts between neighboring axons
identified at the start of the series, 425 (92%) were lost by the end of
the series (compare Fig. 4A and B). Most
remarkably, 56% of the axons lost contact with all of their initial
neighbors. It is therefore evident that the lack of tight coupling
between young axons is due to the nonselective trajectories taken by
individual growth cones and is not due to an incidental disruption of
neighbor relationships that may occur only after growth cones have
chosen their paths.
Dispersion of Initial Neighbors. Not only did growth cones and
axons fail to remain in contact with their initial neighbors but also
the distance separating initial neighbors increased as they advanced
through the stalk. The separation between axons averaged 1.38 µm at 25
µm from the start of the series and averaged nearly twice as much, 2.54
µm, at the end of the series. This dispersion can be clearly appreciated
by comparing the distribution of groups of neighboring fibers in Fig.
4A and B. The ultimate scatter of fibers that were
once neighbors is likely to be considerably greater along the entire
length of the optic pathway. DISCUSSION This study provides evidence that individual retinal ganglion cell
axons and their growth cones do not retain a stable group of neighboring
fibers as they grow through the optic nerve. Even over a relatively
short distance (50 µm, or roughly 4% of the length of the nerve), 56% of
all fibers traced through the set of serial electron micrographs failed
to retain a single neighbor. The progressive loss of neighbors is the
consequence of the nonselective behavior of growing axons and is not due
to the disruption of initially well ordered relationships among fibers
by events such as cell proliferation or the ingrowth of glial processes.
Axon Order and Axon Disorder. In a variety of species, groups
of axons that originate from neighboring cells remain together within
the optic pathway (Meinertzhagen, 1976; Bunt and Horder, 1983; Scholes,
1979; Rusoff, 1984). By tracing bundles of axons labeled with
horseradish peroxidase, usually in adult animals, it has been shown that
order among axons in the optic nerve is related to the retinal
coordinates of ganglion cell bodies and the age at which ganglion cells
are generated. In some animals, particularly perciform fish, it is
possible to predict the position of an axon at any point along the
pathway simply by knowing the site or time of origin of the ganglion
cell. Such findings led to the proposition that a coherent array of
optic axons simply imprints an image of the retina onto the sheet of
target neurons during development, and that additional cues, either
recognition molecules or synchronous activity, are not needed to explain
highly ordered visual connections (Horder and Martin, 1978, Bodick and
Levinthal, 1980; Bunt and Horder, 1983). The results of our study, however, demonstrate that, in the
developing monkey, growth cones change their neighbors rapidly and
disperse away from one another as they extend through the optic stalk.
We saw no evidence that the loss of neighbors might have been related to
systematic rearrangements of fiber relationships. Rather, the changes
most likely result from the unpredictable trajectories taken by
individual growth cones through a complex web of fascicles and glial
processes. Given this result, it is likely that the erratic trajectories
of numerous axons in the more mature nerves of species as diverse as
catfish (Herrick, 1941a), mudpuppy (Herrick, 1941b), Xenopus
(Cook and Horder, 1976; Fawcett, 1981), cat (Horton et al., 1979), and
monkey (Hubel and Wiesel., 1960; Hoyt and Luis, 1962) reflect the
dispersion of fibers during their outgrowth. Factors Limiting Axon Dispersion. It is known that coarse
topography is retained within the optic pathway of primates, and the
majority of axons that enter a particular quadrant of the nerve remain
in that quadrant (Hoyt and Luis, 1962; Polyak, 1957). Thus, it is clear
that the dispersion of axons does not completely scramble retinotopy in
the optic pathway. The extent to which order is perturbed during axon
growth probably depends upon several factors that differ between ages,
between species, and even between different parts of the optic pathway.
The size of the nerve, for example, is likely to affect the magnitude of
dispersion. If the rate at which fibers changed neighbors were constant,
then as the distance between cell body and target cells increased so
would dispersion. Dispersion may be greater at the end of the optic
pathway in species with large and long optic nerves, such as primates,
than in species with small and short nerves. The integrity and size of fascicles may also influence the degree of
dispersion. Provided that fascicles do not fuse or split, the identity
of the fibers in a fascicle will remain unchanged, and dispersion will
be limited by the size of the potential pool of neighbors in the
fascicle. However, in monkeys, fascicles exchange fibers, and may
furthermore eventually contain up to 5000 fibers each, thereby providing
conditions for a high degree of dispersion. The strength of adhesive interactions between neighboring fibers may
also affect dispersion. High affinity between growth cones and the
surfaces along which they grow may mtnimize dispersion (Rutishauser and
Edelman, 1980). If, however, bonds between surfaces are weak, then
dispersion should be greater. In support, it has been reported that when an antibody directed
against a neural cell adhesion molecule is injected into the eye of
chick embryos, axons that originate from neighboring ganglion cells
spread out farther than normal as they grow (Thanos et al., 1984).
Conclusion. Our results demonstrate that in the optic nerve of
the monkey embryo, growing fibers do not maintain precise neighbor
relationships. In spite of this, topographic maps, such as that in the
dorsal lateral geniculate nucleus of primates, develop with a high level
of precision. Clearly, the coarse topography within the nerve and tract
is not a sufficient explanation for the remarkably precise connections
between neurons in the retina and brain. The degree of retinotopic order
in the optic pathway is probably not a decisive factor in the formation
of topographic connections. Acknowledgements We thank Joseph Musco for excellent technical assistance. This work
was supported by Grant EY02593 and Fellowship EY05644 from the National
Eye Institute. References 1. Sperry, R. W. (1943) J. Comp. Neurol. 79, 33—55. 2. Meinertzhagen, I. A. (1976) Philos. Trans. R. Soc. London Ser.
B 274, 555—596. 3. Horder, T. J. & Martin, K. A. C. (1978) Symp. Soc. Exp. Biol.
32, 275—358. 4. Bodick, N. & Levithal, C. (1980) Proc. Natl. Acad. Sci. USA
77, 4374—4378. 5. Bunt, S. M. & Horder, T. J. (1983) J. Comp. Neurol. 213,
94—114. 6. Scholes, J. H. (1979) Nature (London) 278, 620—624.
7. Hubel, D. H. & Wiesel, T. N. (1960) J. Physiol. (London)
154, 572—580. 8. Hoyt, W. F. & Luis, 0. (1962) Arch. Ophthalmol. 68,
124—136. 9. Horton, J. C. , Greenwood, M. M. & Hubel, D. H. (1979) Nature
(London) 282, 720—722. 10. Torrealba, F. , Guillery, R. W. , Eysel, U. , Polley, F. H. &
Mason, C. A. (1982) J. Comp. Neurol. 211, 377—396. 11. Voigt, T. , Naito, J. & Wässle, H. (1983) Exp. Brain Res.
52, 25—33. 12. Rakic, P. & Riley, K. P. (1983) Science 219,
1441—1444. 13. Rager, G. (1980) Naturwissenschaften 67, 280—287.
14. Williams, R. W. & Rakic. P. (1984) Neurosci. Abstr. 10,
373. 15. Easter, S. S. . Jr. , Bratton, B. & Scherer, S. S. (1984) J.
Neurosci. 4, 1173—2190. 16. Williams, W. & Rakic. P. (1985) Invest. Ophthalmol. Vis. Sci.
Suppl. 26, 286. 17. Rusoff, A. C. (1984) J. Neurosci. 4, 1414—1428. 18. Herrick, C. J. (1941a) J. Comp. Neurol. 75,
487—544. 19. Herrick, C. J. (1941b) J. Comp. Neurol. 75,
255—286. 20. Cook, J. F. & Horder, T. J. (1976) Philos. Trans. R. Soc.
London Ser B 278, 261—276. 21. Fawcett, J. W. (1981) J. Embryol. Exp. Morphol. 65,
219—233. 22. Polyak, S. (1957) The Vertebrate Visual System (Univ.
Chicago Press, Chicago). 23. Rutishauser, U. & Edelman, G. M. (1980) J. CelI Biol.
87, 370—378. 24. Thanos, S. , Bonhoeffer, F. & Rutishauser, U. (1984) Proc.
Natl. Acad. Sci. USA 81, 1906—1910. 25. Goodman, C. S. & Bastiani, M. J. (1984) Sci. Am. 251
(6), 58—66. 26. Sjaff, M. & Zeeman, W. P. C. (1924) Albrecht von Graefes
Arch. Klin. Exp. Ophthalmol. 114, 192—211. 27. Gaze, R. M. , Chung, S. H. & Keating, M. J. (1972) Nature
(London) New Biol. 236, 133—135. 28. Easter, S. S. Jr. , Rusoff, A. C. & Kish, P. F. (1981) J.
Neurosci. 1, 793—811. 29. Reh, T. A. , Pitts, F. & Constantine-Paton, M. (1983) J. Comp.
Neurol. 218, 282—296. 30. Scalia, F. & Arango, V. (1983) Brain Res. 266,
121—126. 31. Ehrlich, 0. & Mark, R. (1984) J. Comp. Neurol. 223,
583—591. 32. Silver, J. (1984) J. Comp. Neurol. 223, 238—251.
33. Scholes, J. H. (1981) in Development in the Nervous System,
eds. Garrod, 0. R. & Feldman, J. D. (Cambridge Univ. Press,
Cambridge. England), pp. 181—214. Since 11 August 98
|
Neurogenetics at University of Tennessee Health Science Center
| Print Friendly | Top of Page |
Mouse Brain Library | Related Sites | Complextrait.org
