|
|
|
Note to the Reader
Please refer to: Hogan D, Williams RW (1999) Analysis of the Retinas and
Optic Nerves of Achiasmatic Belgian Sheepdogs. J Comp Neurol 352:367–380.
Print Friendly
Analysis of the Retinas and Optic Nerves of Achiasmatic Belgian Sheepdogs
Dale Hogan and Robert W. Williams
Department of Anatomy and Neurobiology School of Medicine University of
Tennessee Memphis, Tennessee 38163
ABSTRACT
An autosomal recessive mutation carried in a
family of black Belgian sheepdogs eliminates the optic chiasm—all retinal
ganglion cell axons extend directly into the ipsilateral optic tract. One
key issue we are trying to resolve is whether the retina or the chiasm is
the principal site of mutant gene action. In this study, we have examined
retinas of mutants to discover any associated changes in retinal
structure.
Retinas of mutant animals are relatively normal. Inner and outer
nuclear layers are qualitatively indistinguishable from those of normal
dogs. The principal difference is that the area centralis of mutants is
smaller and has a lower peak ganglion cell density than that of normal
dogs (8,100 vs. 10,500/mm2, &NBSP;P <
0.05). This mutant phenotype is similar to that seen in retinas of Siamese
cats and albino ferrets. Beyond area centralis, the central-to-peripheral
gradient in ganglion cell density is normal in mutants. The size of the
optic nerves, density of axons, and total number of axons do not differ
between mutant and normal dogs.
One of three mutant dogs had a small abnormal optic chiasm.
Retrograde labeling of ganglion cells demonstrated that the residual
crossed projection originated from cells in a widespread region in nasal
retina and not solely from the peripheral nasal region, as might be
expected of an anti-albino.
Although our analysis does not rule out the retina as a site of
mutant gene action, the modest differences between mutant and normal
retinas suggest that the mutation either acts outside the retina or exerts
a highly specific effect on ganglion cell trajectories alone.
For the past 30 years, mutations at a single gene locus, the
tyrosinase locus, have had a significant impact on our understanding of
the development of central visual path ways and the formation of sensory
maps (Lund, 1965; Guillery, 1986, 1991). Mutations of this gene are common
in many animals, including rodents, rabbits, cats, ferrets, monkeys, and
humans, and result in varying degrees of pigment deficits (Lerner et al.,
1950; King and Witkop, 1976; Searle, 1989). Two examples are the albino
mutation (the &NBSP;c allele), characterized by a complete lack of
melanin pigmentation, and a temperature-sensitive variant (the &NBSP;ch&NBSP;allele),
typified by the well-studied Siamese cat (Hubel and Wiesel, 1971). These
mutations are of interest to neuroscientists because they also
consistently reduce the number of retinal ganglion cells with uncrossed
projections into the thalamus (Guillery, 1986). Mutations in which the
neuronal connections of the visual system are altered provide excellent
natural experiments and have been instrumental in the rapid progress made
in understanding how the brain processes and represents sensory
information.
We recently identified and described another mutation that changes
the projection pattern of retinal ganglion cells. This novel mutation
eliminates the optic chiasm and results in a complete misrouting of optic
axons into the ipsilateral optic tract (Williams et al., 1994). The
achiasmatic mutation was found in a family of Belgian sheepdogs. This
breed of dog, also known as the Groenendael, weighs 20–30 kg, has a long
solid black coat, and normally pig mented eyes. The pattern of inheritance
indicates that the achiasmatic mutation is carried as an autosomal
recessive allele (Williams et al., 1991). All mutant dogs that we studied
have a persistent horizontal nystagmus often associated with head tilt and
head oscillation (Dell'Osso and Williams, 1994). This behavioral complex
is remarkably similar to that seen in some human albinos and human
achiasmatics (Apkarian et al., 1994).
The achiasmatic mutation shares several features with tyrosinase
mutations: both change the pattern of retinal projections and both are
often associated with abnormal eye position or movements. However, the
polarity of the projection defect is opposite: in achiasmatic animals the
ipsilateral projection is increased, whereas in albinos the ipsilateral
projection is decreased. In addition, the achiasmatic error is usually
complete—the entire nasal projection is redirected into the ipsilateral
tract. Even in the most severely affected albinos, there is always a
residual population of ganglion cells with ipsilateral projections (Balkema
and Drdger, 1990). Because the achiasmatic mutation misroutes the larger
nasal retinal projection, this mutation is quantitatively much more severe
than the partial misdi rection of the smaller temporal projection in
albinos. By pushing the visual system so far out of kilter, the
achiasmatic mutation promises to illuminate processes important for
generating normal retinal connections and sensory maps.
Despite the marked differences between albinos and achiasmatics, our
initial experiments in the lateral geniculate nucleus have shown that the
anatomical and functional consequences are surprisingly similar. The
lateral genicu late of mutant dogs contains a complete functional map of
the ipsilateral visual field in layer A that is contiguous with the normal
map of contralateral visual fields in layer A1 (Williams et al., 1994).
This is similar to the result found in Siamese cats, in which the part of
A1 that receives the abnormally crossed projection contains an aberrant
map of part of ipsilateral visual field. In both Siamese cats and
achiasmatic dogs, the maps in the fused layers A and A1 are arranged in a
mirror-image fashion.
There are two candidate sites at which the achiasmatic gene might act
during development to alter the pattern of retinal projections. The most
obvious site is the developing optic chiasm. The mutation could change the
physical or molecular characteristics of this region and redirect nasal
axons into the wrong optic tract. The other candidate site is the retina.
The mutation could change the cytochemical identity of nasal retinal
ganglion cells, labeling all of them with an "ipsilateral only" marker
that might compel them into the ipsilateral tract. The midline itself
might be perfectly normal. If the mutant phenotype is generated by changes
that are intrinsic to the retina or retinal ganglion cells, then one might
expect correlated changes in retinal structure. The purpose of this study
is to examine the retinas of mutant and normal dogs to determine whether
there is morphological evidence that the mutation acts within the retina.
MATERIALS AND METHODS
Animals used
Retinas and optic nerves were taken from six Belgian sheepdogs (BSD)
and two normal beagles (Table 1). Three of the six sheepdogs from our
colony were mutants. All three displayed marked congenital nystagmus and
were used for mapping studies described elsewhere (Williams et al., 1994).
The other three sheepdogs had normal pheno types and normal eye movements
(DellOsso and Williams, 1994). However, since the achiasmatic mutation is
autoso mal recessive, any of these three normal animals may have been
heterozygous carriers of the mutant gene. For this reason, retinas and
optic nerves from two wild-type normal beagles were also examined.
Table 1. Dogs Used in These Experiments
| Dog |
Sex |
Breed/genotype |
Age at death
(months) |
Weight
(kg) |
HRP |
Ul
U2
UI
MS
M2
MS
Ci
C2 |
M
M
M
M
M
M
M
M |
B5D/unknown
BSD/anknr,wn
B5D/anknown
B5D/mutant
B5D/matant
BSD/mutant
Beagle-type
Beagle-type |
>12
>12
>12
&NBSP;&NBSP;3
&NBSP;&NBSP;6
>12
>12
>12 |
20
21
24
&NBSP;5
16
20
&NBSP;5
&NBSP;9 |
N
Y
N
N
Y
Y
Y
N |
Retrograde tracer injection
Horseradish peroxidase (HRP) was injected unilaterally into the
dorsal lateral geniculate nucleus and optic tract of four animals. These
animals were prepared as described elsewhere (Williams et al., 1994). In
brief, dogs were sedated with ketamine hydrochloride (7 mg/kg) and xyla
zine (0.4 mg/kg). Anesthesia was induced with sodium pentobarbital (15–20
mg/kg) and maintained by infusing sodium pentobarbital (3 mg/kg/hour). A
craniotomy was made and the lateral geniculate located by
electrophysiological means. HRP (30% solution of Sigma Type VI-A) was
injected at several sites with a 10-µl syringe (for detailed methods, see
Chalupa et al., 1984). In three of four cases we then recorded activity in
the noninjected lateral geniculate nucleus for 12 to 24 hours. At the
conclusion of the recording session, animals were killed with a lethal
over dose of sodium pentobarbital (30–40 mg/kg) and perfused
transcardially with either 2.5% gluteraldehyde/ 1% paraformaldehyde or 4%
paraformaldehyde/0. 1% gluteraldehyde. In one case, the incision was
closed and the animal was kept sedated for an additional 24 hours. The
postinjection survival periods were not ideal for retrograde labeling in
animals as large as these dogs. In only two cases did we successfully
label a significant number of retinal ganglion cells.
Retinal wholemounts
Retinas were dissected, and wholemounts were prepared and placed
between two oversized coverslips in Gelvatol (Heimer and Taylor, 1974).
Retinas from animals injected with HRP were processed by using the
Hanker-Yates protocol (Hanker et al., 1977; Perry et al., 1983) and
subsequently mounted in Gelvatol. Mounting in Gelvatol minimizes
distortions and tears that commonly result from dehydrating retinas fixed
to gelatinized slides. Repeated measurements show that this procedure
introduces less than a 2% change in linear dimensions (Williams, 1991). A
second advantage of Gelvatol is that a larger refractive index gradient is
retained in the retina during processing, so that differential
interference contrast (DIC) images of the retinal cell types have more
contrast, making it possible to detect more easily unstained cells in the
nuclear layers. Retinas were examined by using a video microscope equipped
with DIC optics (Curcio et al., 1987). The size of stained and unstained
retinal ganglion cells were measured by using a video-overlay camera
system (Williams et al., 1993).
EM of optic nerves
Optic nerves were prepared for examination with
electronmicroscopy (Williams et al., 1983). In brief, cross sections of
optic nerve approximately 1 mm thick were taken from the midorbital
portion of the optic nerve. Tissue was postfixed with 2% osmium tetraoxide,
stained en bloc overnight with 0.5% uranyl acetate, dehydrated, and
embedded in Spurr's medium. Thin sections were stained with uranyl acetate
and lead citrate. The cross section was photographed at both low power
(80–lOOx nominal magnification) and high power (4,000–6,000x nominal
magnifica tion) with an electron microscope. Actual magnifications were
calculated by using a calibration grid. Low-power micrographs were used to
calculate the cross-sectional area of the optic nerves. High-power
micrographs were taken at 45–55 evenly distributed points across the
nerve. Axons in each micrograph were counted, and the average density of
axons was multiplied by the area of the nerve to estimate the total number
of axons.
RESULTS
As early as 4 weeks of age, mutant animals can be recognized by
their abnormal visual behavior. By 8 to 10 weeks, the horizontal nystagmus
is prominent. Mutants occasionally have other unusual behaviors. Several
mutants in our colony, including two animals used in this study, circled
almost incessantly in their cages when excited. Both also exhibited
uncontrollable self-mutilating behavior that compelled us for ethical and
veterinary reasons to use these animals in terminal experiments.
Figure 1. Vertical views of the chiasm areas of
the brain.

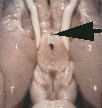

Figure 1. Ventral views of the brains of dogs showing chiasm area.
A: Normal sheepdog (U3). B: Mutant sheepdog with no chiasm
(M3). The upper little hole is the lamina terminalis, which is usually
covered by the chiasm. C: Sheepdog (M2) with a partial chiasm.
Scale bar = 5 mm.
Two of the three mutants used in this study had no crossed
retinofugal projection. Their optic nerves failed to approach the midline
(Fig. 1B) and were separated by 3–5 mm as they entered the thalamus. The
other mutant with congenital nystagmus (M2) had a small and abnormal optic
chiasm (Fig. 1C). With the exception of the optic chiasm, we did not note
any other obvious midline abnormalities in mutants. The corpus callosum
and the anterior and posterior commissures were intact. The hypothalamus
and third ventricle also appeared normal. The three phenotypically normal
sheepdogs, one or more of which may have been heterozygous carriers of the
mutation, had normal optic chiasms (Fig. 1A). In the normal dog, 80–82% of
the axons of retinal ganglion cells cross in the chiasm (Stone, 1983).
Optic nerves
Despite their failure to decussate at the chiasm, the size of the
optic nerves and the density of axons were similar in normal and mutant
dogs (Table 2). The appearance of the axons within the nerves was also
normal in the mutants (Fig. 2). Six optic nerves taken from three normal
dogs gave counts that range from 190,200 to 256,500 (average
211,500±11,000; see Table 3). Counts from three mutants yielded estimates
that ranged from 176,000 to 239,000 (average 215,000±14,900). These
averages were not significantly different (t test). For comparison, three
optic nerves from two beagles were counted and averaged (192,200±15,800).
This number was not significantly different from either group of
sheepdogs.
Anatomy of the retina
In general, the retinas of mutant dogs are remarkably normal.
Retinas from mutants are slightly smaller than those from normal dogs (515
mm2vs. 580 mm2; &NBSP;P
< 0.05: Table 3). Two of the mutants were killed before maturity (Table
1), and the smaller retinal areas may be due only to age differences.
However, mutant M3 had reached maturity and this animal's retinas were
also smaller than those of any of the normal sheepdogs. The proportion of
retina in the area nasal to a vertical line drawn through the area
centralis was calculated. The mutants we studied had a slightly higher
percentage of their retinal area located in nasal retina, 81 vs. 78%. The
distance from the area centralis to the optic disk of mutant and normal
animals was identical.
The photoreceptor mosaic of mutant and normal animals is similar in
density and distribution (Fig. 3A,B). The density of cones in the
peripheral retina (5–10 mm from area centralis) is about 13,400/mm2
in both mutant and normal dogs. The density of rods in the
same areas is S03,000/mm2 for mutant M1 and
493,000/mm2 for the normal dog U2. The outer
nuclear layer of mutants and normal dogs are similar: both are 8–9 cell
nuclei thick (Fig. 3C,D). The inner nuclear layer of mutants and normal
dogs are also similar: both are 3 cell nuclei thick. In addition, the
thickness of both the inner and outer plexiform layers are the same in
mutant and normal dogs.
TABLE 2. Optic Nerve Data
| |
Optic
nerve |
Number of
axons/nerve
(mean ± S.E.M.) |
Density of
axons
in nerve
(axons/mm2) |
Optic
nerve
area
(mm2) |
Normal BSDs
U1
U2
U3
Mutant BSDs
M1
M2
M3
Beagle-type
C1
C2 |
Right
Left
Right
Left
Right
Left
Average
Right
Left
Right
Left
Average
Right
Right
Left
Average |
194,300±11,400
190,200±7,000
231,100±12,100
256,500±11,800
206,400±11,300
190,400±1O,200
211,500±11,000
237,600±23,400
239,900±14,200
176,000±11,700
210,300±10,700
215,900±14,900
200,600±12,400
214,400±12,200
161,600±11,900
192,200±15,800 |
80,300
78,300
76,000
83,000
61,1O0
57,500
72,700±4,400
141,600
79,900
71,500
74,900
92,000±16,600
76,900
68,900
68,800
71,500±2,700 |
2.42
2.43
3.04
3.09
3.31
3.31
2.95±0.17
1.68
3.01
2.46
2.81
2.49±0.29
2.61
3.11
2.35
2.69±0.22 |
TABLE 3. Retinal Data
| |
Eye |
Retinal
area
(mm2) |
Nasal
area
(%) |
Distance
AC to OD
(mm) |
Peak RGC
density
(cells/mm2) |
Normal BSDs
U1
U2
U3
Mutant BSDS
M1
M2
M3
Beagle-type
C1 |
Right
Right
Left
Right
Average
Right
Right
Left
Left
Average
Right
Left
Average |
619.5
562.9
552.2
595.8
582.6±15.4
444.2
524.2
504.9
518.1
497.8±18.4*
619.8
585.8
602.8±24.0 |
78.3
76.2
78.1
79.7
78.1±0.7
78.1
80.8
82.8
83.1
81.2±1.2
78.3
76.4
77.4±1.3 |
4.5
4.1
4.4
4.7
4.4±0.1
3.9
4.3
4.7
4.7
4.4±0.2
4.7
4.9
4.8±0.1 |
9,700
11,200
12,300
8,900
10,500±780
8,100
8,200
8,700
7,300
8,100±300*
13,200
13,800
13,500±480 |
*Significantly different from normal BSDs (P <
0.05).
Retinal ganglion cells
Distribution of ganglion cells. Collectively, the total cell
population in the ganglion cell layer, including glial cells and displaced
amacrine cells, shows a normal central-to-peripheral gradient in the
mutant retina (Fig. 4A). The ganglion cell layer contains about 900,000
cells. This fignre, combined with estimates of the number of retinal
ganglion cells from optic nerve counts, yields a ratio of 3.75:1 of all
cells in the ganglion cell layer to retinal ganglion cells. This is within
the range of 3:1 to 4:1 reported for dogs (Arey and Gore, 1942). The
distribution of retinal ganglion cells in the mutant dog retina is also
similar to that of normal dogs (Fig. 4B; Krinke et al., 1981; Peichl,
1992b). The number of ganglion cells estimated from the isodensity profile
of mutant M2 is 110,000 cells. This fignre is 54% lower than the axon
count from the optic nerve of the same animal (see Discussion).
The retinas of different breeds of dogs have been shown to be
characterized by either a prominent horizontal streak, identified by a
threefold increase in the density of ganglion cells along the horizontal
axis of the eye, or by a moderate horizontal steak characterized by only a
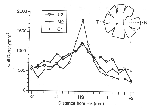
twofold increase in ganglion cell density (Fig. 5; Peichl, 1992b). The
isodensity profile of ganglion cells in both our normal and mutant
sheepdogs is typical of dogs with a moderate horizontal streak (Figs. 4,
5). In contrast, the retinas of a beagle we examined had a prominent
horizontal streak (Fig. 5).
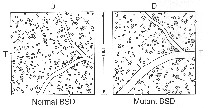
In nasal retina, the number of alpha ganglion cells is similar in
both mutant and normal dogs. In a typical sample area 10 mm nasal and 5 mm
superior to the area centralis (Fig. 6), the proportion of alpha ganglion
cells to all ganglion cells is 3.3% in the normal dog and 3.2% in the
mutant. An unusual feature that has been reported in the dog retina is the
absence of alpha ganglion cells in the peripheral temporal retina (Peichl
et al., 1987; Peichl, 1992b). We also failed to find alpha cells in this
area of temporal retina in either normal or mutant dogs (Fig. 7).
Figure 2. Electron photomicrographs of normal
and mutant dog's optic nerves.
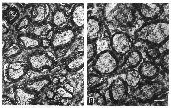
The area centralis of mutant and normal dogs. The most
striking difference between the retinas of normal and mutant dogs is in
the area centralis, the carnivore equivalent of the human macula. The area
centralis is smaller and the peak ganglion cell density is lower in
mutants than in normal dogs (Fig. 8). The peak ganglion cell density in
retinas of three normal dogs averaged 10,500±800/mm2
(range 8,900–12,300; Table 3). In contrast, the peak ganglion cell
density of mutants averaged 8,100±300/mm2 (range
7,300–8,700). This fignre is significantly lower than that of the normal
sheepdogs (P < 0.05). The peak gan glion cell density of the normal
beagle retina with a prominent horizontal streak was 13,500±500/mm2.
These fignres are within the range of average peak ganglion cell densities
reported in retinas of dogs with a moderate visual streak (range 6,400—9,800/mm2),
as well as dogs and wolves with a pronounced horizontal streak (10,300—
14,400 cells/mm2; Peichl et al., 1987; Peichl,
1992b).
Retrograde tracing of the retinogeniculate pathway. HRP was
injected unilaterally into the lateral geniculate nucleus of two mutant
sheepdogs (M2 and M3), one normal sheepdog (U2), and one normal beagle
(C2; Table 1). Although these cases yielded incomplete filling of retinal
ganglion cells, cases M2 and C2 yielded sufficient labeling to identify
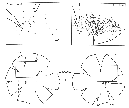
unequivocally ganglion cells in large areas of the retina. In case M2, the
sheepdog with a small residual chiasm, HRP tracing showed that the
residual crossed projection originates primarily from ganglion cells in
para central and peripheral nasal retina, although a few cells also
appeared to originate in temporal retina (Fig. 9). The contralateral and
ipsilateral projections did not originate in precisely the same part of
each retina; the large population of nasal cells with ipsilateral
projections was located closer to the area centralis of the ipsilateral
retina than the labeled cells in the contralateral retina.
The sizes of HRP-labeled cells were measured to determine if there
was en masse respecification of nasal retinal ganglion cells that could be
detected as changes in the distribution of ganglion cell size,
particularly in the nasal hemiretina. In this respect, the mutant (M2)
with the partial chiasm was particularly informative because we were able
to compare the sizes of both aberrantly and normally projecting nasal
ganglion cells within a single mutant animal as well as with nasal
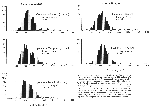
ganglion cells in the normal dog (C1). Cell body areas of HRP-labeled
retinal ganglion cells of this mutant and that of the beagle were similar
(Fig. 10). Cell areas are similar in the normal projections of the mutant
(i.e., ipsilateral temporal: 500 in M2 vs. 460 µm2
in C1, and contralateral nasal: 500 vs. 500 µm2).
The area of cells in the large aberrant projection of the mutant (ipsilateral
nasal; 490 µm2) is similar to the areas of cells
with normal decussation patterns.
DISCUSSION
We have quantified several aspects of retinal structure in a novel
mutation that is carried in dogs. In this mutation, all optic nerve fibers
extend into the ipsilateral optic tract. Our intent was to determine
whether there is evidence that the retina is a primary site of mutant gene
action. The principal difference we observed between retinas of mutants
and normal dogs is the lower density of retinal ganglion cells in area
centralis.
Figure 3. Photomicrographs of photoreceptor
layers from retinas of normal and achiasmatic sheepdogs.
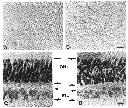
General observations on the canine retina
The extreme polymorphism among different breeds of dogs has led
investigators to bypass this species as a model for vision research.
Peichl exploited this variation and compared the topography of retinal
ganglion cells in several breeds of domestic dog and in the wolf (Peichl,
1992a,b). Our work has largely confirmed key aspects of his work. We have
also identified dog retinas with either a prominent or a moderate
horizontal streak, have verified Peichi's estimates of peak ganglion cell
density, and have noted the lack of alpha cells in far peripheral temporal
retina.
Our optic nerve counts in eight normal and mutant dogs (Table 2)
range from a low of 160,000 to a high of 260,000 with an average of
210,000. By using another method, the isodensity contour method, Peichl
(1992b) estimated that the retinas of two dogs in his study contained
110,000 and 121,000 ganglion cells. These estimates are 45% lower than our
counts of fibers in the optic nerve. Peichl's estimates are also lower
than those of Arey's group (Arey et al., 1942; Arey and Gore, 1942). These
studies, based on light microscopic analysis of the optic nerve (a
technique that consistently underestimates the number of axons), estimated
138,000–165,000 axons in the optic nerves of dogs of various breeds.
Retinal analysis in these studies yielded estimates of 153,000–192,000
ganglion cells. These figures overlap the lower end of the range of values
we obtained.
To help resolve this problem we estimated ganglion cell number with
the isodensity contour method (case M2; see Fig. 4B) and obtained a count
of 110,000 ganglion cells. This value is similar to the estimates of
Peichl from using the same method, but it is 54% lower than our estimates
of axons in the optic nerve of the same animal. Estimates of axons in each
optic nerve provide an accurate estimate of the total number of ganglion
cells in the retina in both the cat (Chalupa et al., 1984) and the mouse
(Rice et al., 1994). Therefore, we believe that this difference is most
likely due to systematic undercounting of ganglion cells in the whole
mounts. Regardless, our results unequivocally show that the achiasmatic
phenotype is not due to the loss of ganglion cells in the nasal hemiretina.
Figure 4. Isodensity profiles of mutant
sheepdogs.
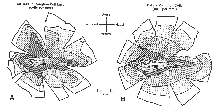
Figure 5. Density of ganglion cells
perpendicular to the horizontal streak of mutant and normal sheepdogs.
The finding that there are no alpha ganglion cells in the far
temporal retina of dogs is particularly intrigning be cause it is the only
known example of this phenomena in mammalian retina (Peichl et al., 1987).
Peichl speculated that this may be a result of the relatively large snout
that results in a deprivation-like effect in the far temporal retina.
Whether the lack of alpha cells in a portion of the temporal retina is a
deprivation induced effect or is an intrinsic attribute of canine retina
is unknown. Whatever the cause, this unusual distribution is unaffected by
the achiasmatic mutation.
Effects of the achiasmatic mutation on the retina
Deficits in the area centralis. The primary defect found in
the retinas of mutant dogs is a reduction in the size of the area
centralis and a reduction in the peak ganglion cell density. This deficit
is similar to those observed in the retinas of tyrosinase mutations of
other species. In the retinas of Siamese cats, albino cats, and albino
ferrets, the area centralis is smaller and has a lower peak ganglion cell
density when compared with normally pigmented animals (Stone et al., 1978;
Cucchiaro and Guillery, 1984; Leven thal and Creel, 1985; Morgan et al.,
1987). In albino primates the fovea is also undeveloped. Both human and
green monkey albinos lack a fovea (Fulton et al., 1978; Guillery et al.,
1984). Like the mutant dogs, the gradient of ganglion cells in the
periphery of the retinas of albinos is normal.
Guillery et al. (1984) speculated that the albino mutation may act
directly to modify the structure of the area centralis. The fact that
achiasmatic dogs have similar structural deficits suggests that the
defects in area centralis is not caused directly by the albino mutation
itself but is a secondary effect produced by decussation errors. Albinos
of many species and achiasinatic humans and dogs exhibit abnormal eye
movements or position which could prevent the affected animal from
maintaining a stable image on the retina. It is possible that the deficits
in the central retinas of these two different mutations is secondary to
these abnormalities.
Figure 6. Distribution of ganglion cells in one
square millimeter of a normal and mutant sheepdog.
Other retinal differences. Although the major effect in
mutant retina was seen in area centralis, several other differences were
noted, namely, retinal area and the ratio of nasal and temporal retinal
areas. Given the small sample size and age differences between groups, we
do not believe that these differences have much biological significance.
Visual system mutations and decussation patterns
Site of gene action in misrouting of the retinal projection.
An aim of this study was to determine whether the retina is a site of
mutant gene action. If we had found highly unusual structure in the nasal
hemiretina, this would have provided strong evidence of a retinal site of
gene action that might account for the failure of nasal ganglion cells to
cross at the optic chiasm. We did not find any unusual cellular properties
in either nasal or temporal retina. However, our study and a review of
previous work do provide some clues regarding possible sites of gene
action in this mutation.
Studies have shown that the ratio of axons that project
ipsilaterally or contralaterally changes during develop ment. In most
species, the first axons to reach the optic chiasm project ipsilaterally (Godement
et al., 1990; Reese et al., 1992; Baker and Reese, 1993). At later stages,
more axons are directed contralaterally. Nearly all of the last axons to
arrive at the chiasm cross. This has led several researchers to propose
that a signal that is expressed early in retinal development favors
ipsilateral projections and that this signal weakens over time (Walsh et
al., 1983; Reese et al., 1991, 1992; Reese and Colello, 1992; Baker and
Reese, 1993).
Studies in mice and cats have shown that axons from nasal and
temporal retinas are intermingled in the optic nerve throughout
development. As the fibers approach the chiasm, they sort and either cross
or do not cross with a surprising degree of accuracy (Godement et al.,
1990; Jeffery, 1990; Sretavan, 1990; Chalupa and Lia, 1991). These data
implicate a factor near the chiasm that the axons respond to
differentially. Temporal axons frequently grow right up to the midline
before turning into the ipsilateral optic tract. This suggests that there
is a repulsive interaction specific to a subpopulation of temporal
ganglion cell growth cones (Bonhoeffer and Huf, 1985; Godeinent et al.,
1990).
Given this background, what types of developmental changes could
account for the complete elimination of a crossed retinal projection? One
possibility, suggested by the mostly ipsilateral projection of the
earliest arriving axons, is that the achiasmatic mutation results from an
accelera tion in the time of genesis of retinal ganglion cells. How ever
because the achiasmatic phenotype is so extreme and because retinal
ganglion cells in carnivores are born over a 2-week period (Walsh and
Polley, 1985), it is difficult to imagine that a disruption in timing
alone that would be sufficient to cause this massive misrouting.
Figure 7. Photomicrographs from the retinal
ganglion cell layer of beagle and mutant dogs.

A second possibility could be a mispecification of retinal ganglion
cells in the achiasmatic mutants. Chan et al. (1993) postulated that the
albino mutation acts within the retina to change a putative retinal
gradient that causes most early cells to remaln ipsilateral, resulting in
more crossed axons, as well as a shift in the decussation line toward the
ventral temporal periphery. The data from the mutant dog with a partial
chiasm argnes against a change in retinal gradients analogous (but
opposite) to that of the albino because this animal did not exhibit a
simple shift in the line of decussation into the nasal periphery. In
addition, our previous study in the lateral geniculate nucleus of mutant
dogs strongly suggest that retinal positional specificity is not affected
by this mutation because axons are correctly targeted within the lateral
geniculate nucleus: nasal axons terminate in layer A and temporal axons in
layer Al with appropriate retinotopy despite the decussa tion error
(Williams et al., 1994).
Figure 8. Density of ganglion cells in the area
centralis of mutant and normal dogs.

A third possibility is that the optic nerve itself grows in an
aberrant direction. Guillery and Walsh (1987a,b) reported the early
appearance of a small bundle of optic fibers in ferrets that do not enter
the chiasm. These fibers, collec tively called the ipsilateral optic
bundles, grow laterally and ventrally around the hypothalamus and never
approach midline. Even though these are the first fibers to leave the
optic stalk and enter the brain, the later arriving fibers do not normally
follow the ipsilateral optic bundles but enter the chiasm. However, in the
achiasmatic dogs, all axons may follow the pathway taken by the
ipsilateral optic bundles. This hypothesis is attractive because it would
explain why, in most mutants, the optic nerves do not approach midline. If
the defect were at the midline itself, we would expect that the nerves
would grow up to, but not cross, the chiasm.
Figure 9. Drawings of ganglion cells in the
retinas of mutant M2.
Is the achiasmatic mutant an "anti-albino"?
Despite the obvious reversed polarity of the decussation defect in the
achiasmatic dog, this mutation is not simply an anti- albino. In albinism,
the line of decussation, although not as sharp as that in normal animals,
is shifted toward the temporal edge of the retina. In addition, there is
always a residual uncrossed projection. In the achiasmatic dog, there is
usually no residual crossed projection. However, as case M2 illustrates,
the achiasmatic mutation can occasionally be incomplete. If this mutation
were an anti-albino, the expected effect of a partial decussation would be
a line of decussation that is shifted to the nasal side of the retina,
perhaps to the other side of the optic disk. In fact, the residual crossed
projection originates throughout nasal retina, not solely in far
peripheral nasal retina, as would be expected of an anti-albino.
Figure 10. Comparison of cell body areas between
achiasmatic BSD and normal beagles.
Although the albino mutation usually causes a shift in the line of
decussation toward the temporal periphery, there is a report in the
literature of a single individual, an albino ferret, with a decussation
pattern analogous to that of the dog with a partial chiasm (Morgan et al.,
1987). In this anomalous albino, the ipsilateral component arose from the
nasal retina (see Fig. 9; Morgan et al., 1987). As in our mutant dog M2,
this particular ferret did not have a shift in the decussation line, but
the areas of the highest densities of labeled cells were found in
approximately the same area of both nasal retinas.
A comparison with the acallosal mutation. The acallo sal
mutation is another mutation in which axons fall to cross midline. In four
strains of mice (BALB/cWahl, BALB/cWah2, J/Ln, and 129/Re), this callosal
abnormality is highly variable and appears to be a polygenic trait
involving two or three loci (Livy and Wahlsten, 1991). In contrast, the
pattern of inheritance of the achiasmatic mutation is most consistent with
an autosomal recessive mutation at a single locus. The elegant studies of
Silver et al. (1982) and Silver and Ogawa (1983) showed that the acallosal
phenotype is a mutation that directly affects midline. Callosal axons
cannot cross because the substrate that they normally grow along, the
glial sling, fails to form. Comparable developmental studies of
achiasmatic dogs could may reveal whether or not there is an analogous
defect in the floor of the hypothalamus that does not support the crossing
of nasal axons.
In acallosal mice and humans, cortical efferents, both "callosal"
and ipsilateral corticocortical, accumulate to form a swirling ipsilateral
pathway or neuroma known as "Probst's longitudinal bundle" (King, 1936;
Silver et al., 1982). By analogy, one might expect retinal axons in
achiasinatic mutants to form a similar tangle in the area where the optic
chiasm should form. However, this does not happen—axons extend straight
back into the optic tract.
Some axons are able to escape Probst's bundle and form appropriate
connections to both ipsilateral and contralat eral hemispheres (Ozaki and
Shimada, 1988; Ozaki et al., 1989). The fact that these connections are
topographically appropriate is analogous to the condition in achiasmatic
mutants: optic axons terminate in the ipsilateral lateral geniculate
nucleus with appropriate retinotopy despite their failure to cross midline
(Williams et al., 1994). This suggests that both mutations specifically
perturb crossing at the midline but do not perturb target recognition. The
fact that the optic chiasm is normal in acallosal mice and that the corpus
callosum is apparently normal in achias matic dogs emphasizes that
multiple loci control the devel opment of midline structures.
Specificity of mutation. This study of the effects of the
achiasmatic mutation on the retina reinforces the results of our
physiological and anatomical studies of the lateral geniculate nucleus of
achiasmatic sheepdogs. It is surprising how normal the visual system of
these animals is considering over 80% of the retinal ganglion cells are
misrouted. This massive rerouting might be expected to disrupt severely
the normal architecture in the brains and retinas of affected animals. The
relatively minor perturbation of retinal structure also reinforces the
remarkable selectivity of action of this achiasmatic mutation.
ACKNOWLEDGMENTS
This work was supported by NRSA grant EY06560 to D. H. and NIH grant
EY-6627 to R. W. W.
LITERATURE CITED
Apkarian, P., L. Bour, and PG. Barth (1994) A unique achiasmatic anomaly
detected in non-alhinos with misrouted retinal—fugal projections. Eur. J.
Neurosci. 6: 501—507.
Arey, LB., S.R. Bruesch, and S. Castanares (1942) The relation between
eyehall size and the numher of optic nerve fibers in the dog. J. Comp.
Neurol. 76: 417—422.
Arey, L.B., and M. Gore (1942) The numerical relation hetween the ganglion
cells of the retina and the fibers in the optic nerve of the dog. J. Comp.
Neurol. 77: 609—617.
Baker, G.E., and B.E. Reese (19931 Chiasmatic course of temporal retinal
axons in the developing ferret. J. Comp. Neurol. 330: 95—104.
Balkema, G.W., and U.C. Drager (19901 Origins of uncrossed retinofugal
projections in normal and hypopigmented mice. Vis. Neurosci. 4:
595—604.
Bonhoeffer, F., and J. Huf (1985) Position-dependent properties of retinal
axons and their growth cones. Nature 351: 405—410.
Chalupa, L.M., and B. Lia (1991) The nasotemporal division of the retinal
ganglion cells with crossed and uncrossed projections in the fetal rhesus
monkey. J. Neurosci. 11: 191—202.
Chalupa, L.M., R.W. Williams, and Z. Henderson (1984) Binoclular interac
tion in the fetal cat regulates the size of the ganglion cell population.
Neuroscience 12: 1139—1146.
Chan, SO., G.E. Baker, and EW. Guillery (1993) Differential action of the
albino mutation on two components of the rat's uncrossed retinofugal
pathway. J. Comp. Neurol. 336: 362—377.
Cucchiaro,J., and R.W. Guillery (1984) The development of the retinogenicu
late pathways in the normal and alhino ferret. Proc. R. Soc. Lond. [Biol.]
223: 141—164.
Curcio, C., 0. Packer, and RE. Kalina (1987) A wholemount method for
sequential analysis of photoreceptor and ganglion cell topography in a
single retina. Via. Res. 27: 9—15.
Dell'Osso, L.F., and R.W. Williams (1994) Ocular motor ahnormalities in
achiasmatic Begian sheepdogs: Unyoked eye movements in a mammal. Vis. Res.
in press.
Fulton, A.B., D.M. Alhert, and J.L. Craft (1978) Human alhinism: Light and
electron microscopy study. Arch. Opthalmol. 96: 305—310.
Godement, P., J. Salaun, and CA. Mason (1990) Retinal axon pathfinding in
the optic chiasm: divergence of crossed and uncrossed fibers. Neuron 5:
173—186.
Guillery, R.W. (1986) Neural ahnormalities of albinos. Trends Neurosci.
9: 364—367.
Guillery, R.W. (1991) Rules that govern the development of the pathways
from the eye to the optic tract in mammals. In D.M.-R. Lam and C.J. Shatz
(eds.): Development of the Visual System, Vol.3. Cambridge, MA: MIT, pp.
153—171.
Guillery, R.W., T.L. Hickey, J.H. Kaas, D.J. Fellemam, E.J. Dehruyn, and
D.L. Sparks (1984) Ahnormal central visual pathways in the brain of an
albino green monkey (Cercopithecus aethiops). J. Comp. Neurol.
226: 165—183.
Guillery, R.W., and C. Walsh (1987a) Changing glial organization relates
to changing fiher order in the developing optic nerve of ferrets. J. Comp.
Neurol. 265: 203—217.
Guillery, EW., and C. Walsh (1987b) Early uncrossed component of the
developing optic nerve with a short extracerebral course: A light and
electron microscopic study of fetal ferrets. J. Comp. Neurol. 265:
218—223.
Hanker, J.S., P.R. Yates, C.B. Metz, and A. Rustioni (1977) A new
specific, sensitive and non-carcinogenic reagent for the demonstration of
horse radish peroxidase. Histochem. J. 9: 789—792.
Heimer, G.V., and CED. Taylor (1974) Improved mountant for immunofiu
orescence preparations. J. Clin. Pathol. 27: 254—256.
Hubel, D.H., and TN. Wiesel 11971) Aberrant visual projections in the
Siamese cat. J. Physiol. 218: 33—62.
Jeffery, G. (1990) Distribution of uncrossed and crossed retinofugal axons
in the cat optic nerve and their relationship to patterns of
fasciculation. Via. Neurosci. 5: 99—104.
King, L.S. (1936) Hereditary defects of the corpus allosum in the mouse,
Mus musculus. J. Comp. Neurol. 64: 337—363.
King, R.A., and Cd. Witkop (1976) Hairbulb tyrosinase activity in
oculocutaneous albinism. Nature 263: 69—71.
Krinke, A., K. Schnider, E. Lundheck, and G. Krinke (1981) Ganglionic cell
distribution in the central area of the hoagie dog retina. Zbl. Vet. Med.
C. Anat. Histol. Embryol. 10: 26—35.
Lerner, A.B., T.B. Fitzpatrick, E. Calkins, and S.W.H. Summerson (1950)
Mammalian tyrosinase: The relationship of copper to enzyme activity. J.
Biol. Chem. 187: 793—802.
Leventhal, A.G., and D.J. Creel (1985) Retinal projections and functional
architecture of cortical areas 17 and 18 in the tyrosinase-negative albino
cat. J. Neurosci. 3: 795—807.
Livy, D.J., and D. Wahlsten (1991) Tests of genetic allelism between four
inhred mouse strains with absent corpus callosum. J. Hered. 82:
459—464.
Lund, RD. (1965) Uncrossed visual pathways of hooded and alhino rats.
Science 149: 1506—1507.
Morgan, J.E., Z. Henderson, and I.D. Thompson (1987) Retinal decussaton
patterns in pigmented and aihino ferrets. Neuroscience 20: 519—535.
Ozaki, H.S., and M. Shimada (1988) The fihers which course within the
Probst's longitudinal bundle seen in the hrain of a congenitally acallosal
mouse: A study with the horseradish peroxidase method. Brain Res. 441:
5—14.
Ozaki, H.S., K. Iwahashi, and M. Shimada (1989) Ipsilateral
corticocortical projections of fibers which course within Probst's
longitudinal hundle seen in the hrains of mice with congenital absence of
the corpus callosum: A study with the horseradish peroxidase method. Brain
Res. 493: 66—73.
Peichl, L. (1992a) Morphological types of ganglion cells in the dog and
wolf retina. J. Comp. Neurol. 324: 590—602.
Peichl, L. (1992b) Topography of ganglion cells in the dog and wolf
retina. J. Comp. Neurol. 324: 603—620.
Peichl, L., H. Ott, and B.B. Boycott (1987) Alpha ganglion cells in mamma
lian retinae. Proc. R. Soc. Lond. B 231: 169—197.
Perry, V.H., Z. Henderson, and R. Linden (1983) Postnatal changes in
retinal ganglion cell and optic nerve populations in the pigmented rat. J.
Comp. Neurol. 219: 356—368.
Reese, BE., and R.J. Colello (1992) Neurogenesis in the retinal ganglion
cell layer of the rat. Neuroscience 46: 419—429.
Reese, B.E., R.W. Guillery, and C. Mallarino (1992) Time of ganglion cell
genesis in relation to the chiasmatic pathway choice of retinofugal axons.
J. Comp. Neurol. 324: 336—342.
Reese, B.E., EW. Guillery, CA. Marzi, and G. Tassinari 119911 Position of
axons in the cat's optic tract in relation to their retinal origin and
chiasmatic pathway. J. Comp. Neurol. 306: 539—553.
Rice, D.S., EW. Williams, and D. Goldowitz (1994) Genetic control of
retinal projections in inbred strains of albino mice. J. Comp. Neurol.,
(in press).
Searle, A.G. (1989) Comparative genetics of albinism. Ophtal. Paed. Genet.
11: 159—164.
Silver, J., SE. Lorens, D. Wahlsten, and J. Coughlin (1982) Axonal
guidance during development of the great cerebral commissures: Descriptive
and experimental studies, in vivo, on the role of preformed glial
pathways. J. Comp. Neurol. 210: 10—29.
Silver, J., and M. Ogawa (1983) Postnatally induced formation of the
corpus callosum in acallosal mice on glia-coated cellulose bridges.
Science 220: 1067—1069.
Sretavan, D.W. 119901 Specific routing of retinal ganglion cell axons at
the mammalian optic chiasm during emhryonic development. J. Neurosci.
10: 1995—2007.
Stone, J. (1983) Parallel Processing in the Visual System: The
Classification of Retinal Ganglion Cells and Its Impact on the
Neurobiology of Vision. New York: Plenum.
Stone, J., M.H. Rowe, and J.E. Campion (1978) Retinal abnormalities in the
Siamese cat. J. Comp. Neurol. 180: 773—782.
Walsh, C., and E.H. Polley (1985) The topography of ganglion cell
production tn the cat's retina. J. Neurosci. 5: 741—750.
Walsh, C., E.H. Polley, T.L. Hickey, and EW. Guillery (1983) Generation of
cat retinal ganglion cells in relation to central pathways. Nature 302:
611—614.
Williams, R.W. (1991) The human retina has a cone-enriched rim. Vis.
Neurosci. 6: 403—406.
Williams, R.W., M.J. Bastiani, and L.M. Chalupa (1983) Loss of axons in
the cat optic tract following prenatal unilateral enuclearion: an electron
microscopic analysis. J. Neurosci. 3:133—144.
Williams, R.W., C. Cavada, and F. Reinoso-Suarez (1993) Rapid
evolution of the visual system: A cellular assay of the retina and dorsal
lateral geniculate nucleus of the Spanish wildcat and the domestic cat. J.
Neurosci. 13: 208—228.
Williams, R.W., P.E. Garraghty, and D. Goldowitz (1991) A new visual
system mutation: Achiasmatic dogs with congenital nystagmus. Soc. Neurosci.
Abstr. 17: 187.
Williams, R.W., D. Hogan, and P.E. Garraghty (1994) Target recogntion
and visual maps in the thalamus of achiasmatic dogs. Nature 367:
637—639.
THE JOURNAL OF COMPARATIVE NEUROLOGY 352:
367-380 (1995)
Accepted August 8, 1994.
|
|
|

 Publications


