 |
| ||||||
|
| ||||||||
|
| ||||||||
Home  Databases Databases |
|
|
Mouse Genetic Map Files
The following files are in text or Map Manager format. You can download Macintosh or Windows versions of Map Manager at the Map Manager QTX web site. Many files have been bin-hexed (files with the ".hqx" suffix). You will
need a decoding utility such as BinHqx or Stuffit Expander (available for
Mac and Win) to decode Map Manager files. To configure your web browser to
automatically launch a Map Manager file after downloading and decoding,
add Map Manager as a helper application for the MIME type " A Tenth Generation Advanced Intercross Map Manager filesR.W. Williams and G. Zhou, November 2000 Update
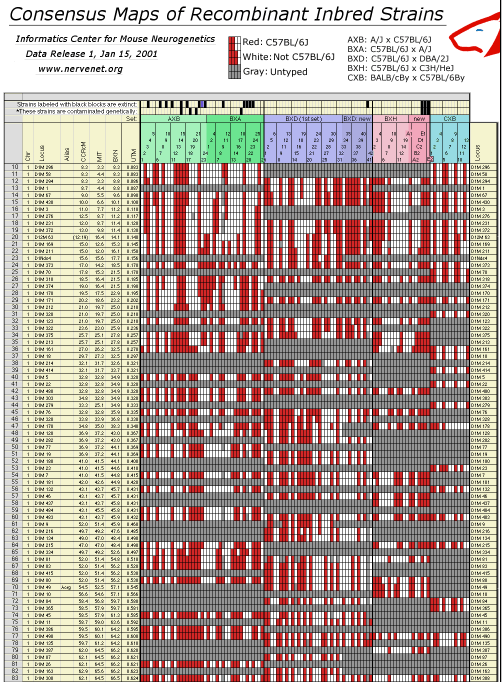
Recombinant Inbred Map Manager filesComposite High-Resolution RI Microsatellite Maps, Release 1, Jan 15, 2001Release 1 of the Consensus Maps of RI Strains is described in a preprint included with the data release. RI consensus maps were assembled from genotypes of over 1500 microsatellite loci by R. Williams and colleagues (Informatics Center for Mouse Neurogenetics).
R.W. Elliott, 1997 edition
MIT F2 Intercross Panel Data FilesThese files were generated from the Whitehead/MIT Center for Genome
Research SSLP F2 panel, Release 9 (April 1995) by R.W Williams. All
chromosome-specific files are under 80 KB.
Jackson Lab Backcross Panel Map DataThe following two files were provided by Lucy Rowe of theJackson Laboratory (see Rowe et al. (1994) Mammalian Genome 5:253). Please contact Lucy Rowe (lbr@aretha.jax.org) or Mary Barter (meb@aretha.jax.org) if you have specific questions regarding either dataset. These datasets were obtained Feb. 1996.
Shionogi LociThe following three files were provided by V. Chapman and K. Manly, Roswell Park Institute. A paper describing these loci is now in press. Please contact Drs. Chapman and Manly if you have specific questions regarding these files.
Copeland-Jenkins-MIT map � 246 KBThis Map Manager file includes the data that were used to generate the poster "Genome Maps IV, The Mouse." This poster accompanied an article by Copeland et al (1993, Science 262:57-66) entitled, "A genetic linkage map of the mouse: Current applications and future prospects." This Map Manager file includes data on 912 loci typed in a group of 203 interspecies backcross animals (C57BL/6JxSPRET/Ei)xC57BL/6J. The order of loci and their positions were fine-tuned by R. Elliott.
The nomenclature has been updated and corrected by R. Williams. As
explained in detail below, the order and positions of loci in the Map
Manager file may differ somewhat from those on the Genome Maps IV poster.
Copeland-Jenkins-MIT map dataNotes on this Map Manager file by R. Elliott and R. Williams (March 10, 1994) The original file was obtained from the Center for Genome Research via anonymous ftp at ftp://genome.wi.mit.edu/. Nomenclature of loci was brought into concordance with the Portable Dictionary of the Mouse Genome. The file was transferred to Microsoft Word, reformatted, and imported into Map Manager 2.5. Once in Map Manager, the ends of each map were anchored using proximal and distal loci that were shared between the Mouse Chromosome Committee Reports and the Copeland/Jenkins backcross panel. Loci typed by Neil Copeland, Nancy Jenkins, and their co-workers were ordered in sequence, working from the ends toward the middle of each map. The "Links Report" feature of Map Manager�set at 99.99% probability�was used to position loci with the highest LOD scores. Other loci were added and ordered using internal recombination data. The process was repeated until the loci overlapped in the middle of each map. The MIT SSLP marker loci were added next. These microsatellite loci were moved in groups that shared similar progeny distribution patterns (PDPs). The "Links Report" feature was used again, and sets of loci with similar PDPs were again shifted and reordered. Following this integration between the two types of loci, the data set was reexamined to find all single locus double recombinants. The order of loci was adjusted. A DISTANCE CAVEAT: The map distances given in the map window of Map Manager differ somewhat from those published on the Genome Maps IV poster. These Map Manager position estimates do not take into account obligate crossovers that are not completely defined. However, the map distances in the haplotype window of Map Manager do take these crossovers into account, and consequently, the distances given in this window often differ from those in the map window. (The haplotype window splits the difference on the undefined crossovers, assuming that the recombination event occurred in the middle of the interval.) A third distance estimate may be obtained by using the "infer phenotypes" feature in Map Manager. Note however, that this "infer phenotypes" feature was developed for maps that use completely typed anchors. In this Fredrick-MIT dataset the anchors are not established and the recombinant animals were often not typed for the loci on either side of the crossover. (The choice of animals to be typed probably varied between loci and was apparently based on other criteria.) Thus using "infer phenotypes" skews the data in favor of non-recombinants, giving a low estimate of the distance. In contrast, the data used in the map window in which phenotypes are not inferred may be skewed the other way for some of the loci.
|
Neurogenetics at University of Tennessee Health Science Center
| Text Only | Top of Page |
Mouse Brain Library | Related Sites | Complextrait.org
