![]()
Note to the reader: This is a revised edition of a
paper published in Cerebral Cortex (1998;8:753–761). The
definitive original is copyright ©1998 by Oxford University
Press.
New figures, text, and links have been incorporated
into the revision. Revised HTML (http://www.nervenet.org/netpapers/Rosen/Parv98/RosenParv.html)
copyright ©1999 by Glenn
D. Rosen
Effects of Neonatal Freeze Lesions on Expression of Parvalbumin in Rat Neocortex
Glenn D. Rosen, Kimberle M. Jacobs*, &
David A. Prince*
Dyslexia Research Laboratory, Beth Israel Deaconess Medical Center; Division of
Behavioral Neurology , Beth Israel Deaconess Medical Center, 330
Brookline Avenue, Boston MA 02215; Harvard Medical School, Boston,
MA 02115 * Department of Neurology and Neurological Sciences,
Stanford University Medical Center, Stanford, CA 94305–5300
Department of Neurology
Beth Israel Deaconess Medical Center
330 Brookline Ave
Boston, MA 02215 USA
Phone: (617) 667–3252
Fax: (617) 667–5217
Email: grosen@caregroup.harvard.edu
Neonatal freeze lesions to the cortical plate result in focal malformations of the cerebral cortex resembling four-layered
microgyria. These malformations have been associated with local
and distant changes in neuronal architecture, and have been implicated
in the neocortical epileptiform discharges that can spread up
to 4 mm away from the malformation itself. In an effort to assess
potential changes in the development of one population of inhibitory
interneurons in this malformation, we measured the density of
parvalbumin-immunoreactive (ParvIR) neurons in microgyric and
control cerebral cortex on postnatal days 13, 15, 21 and 64.
In comparison to controls, microgyric animals exhibited a transient
decrease in the expression of ParvIR in supragranular neurons,
both within the malformation itself and in normal six-layered
cortex up to 2 mm adjacent to it. This difference disappeared
by P21. In addition, there was a permanent diminution of the
density of ParvIR neurons in infragranular layers both within
and immediately adjacent to the microgyrus. These results indicate
that early injury to the cortical plate gives rise to both focal
and more widespread changes in cortical architecture.
Cortical malformations induced in rodents by injury to the cortical plate during neuronal migration provide a model for study of disorders such as dyslexia and epilepsy. A malformation resembling four-layered microgyria is produced by hypoxic/ischemic damage to the developing cortical plate following either cold injury (1-8) or ibotenic acid injections (9,10) during the period of late neuronal migration.
The anatomic and physiologic consequences of focal freeze lesions are seen not only locally within the damaged cortex, but also in regions outside of the malformation. Glutamatergic fibers are nearly absent in the microgyric region but are present and disorganized in adjacent cortex, which appears in Nissl stains to be unaffected (3). This region adjacent to the microgyrus has also been shown to be epileptogenic (6,7). Epileptiform discharges evoked with in this paramicrogyral zone spread as much as 2–4 mm from the site of stimulation (6,7). Recent findings have suggested hemisphere-wide changes in the levels of excitatory and inhibitory receptor binding. Specifically, AMPA, Kainate, and NMDA receptors are up-regulated while both gamma-aminobutyric acid-A (GABAA) and GABAB receptors are down-regulated throughout the cerebral cortex ipsilateral to the cortical lesion (11,12). Finally, evidence suggests that this focal malformation can alter behavior as well. Microgyric male rats (but not females) have difficulty performing a fast auditory discrimination task (13,14), and this difference is reflected in the distribution of neuronal sizes in the medial geniculate nuclei of these animals (15).
Jacobs et al. (6)
recently reported a near absence of parvalbumin-like immunoreactive
cells in microgyria induced by freeze injury. A decrease of these
cells in other induced malformations of rodent cortex, and in
focal cortical regions from an epilepsy patient has also been
described (5,16).
However, gross examination of the density
of parvalbumin-immunoreactive (ParvIR) neurons in tissue from
adult microgyric rats did not show any obvious decrease (unpublished
observations). Because the results reported by Jacobs et al.
(6)
were from immature animals, the possibility existed that there
might be age-related differences in parvalbumin expression in
the microgyric rats. In the current study we qualitatively and
quantitatively examined this question with tissue taken from
two laboratories at three different ages. We hypothesized that
there was a temporary down-regulation of parvalbumin expression
in malformations induced by freeze injury. In addition, we sought
to determine whether there were any transient or long-term changes
in parvalbumin expression in regions outside of the microgyrus.
METHODS
The data presented here were collected from a series of brains
prepared in laboratories at Beth Israel Deaconess Medical Center
(BIDMC) and Stanford University Medical Center (SUMC). Although
the histologic and histochemical procedures differed slightly
between the two groups, post-hoc analysis (see Results) showed
no difference in the data derived from the two laboratories.
As the majority of the methods have been described in detail
elsewhere, they are only outlined briefly here with the small
differences in techniques noted when appropriate.
Induction of Freeze Injury
BIDMC. Microgyria were induced by a modification
of the technique of Dvorák and colleagues (1,2), reported
in detail elsewhere (3,4).
Pregnant Wistar rats were obtained from Charles
River (Wilmington, MA) and on the day after birth (P1), their
pups were anesthetized with hypothermia, and a small anteroposterior
incision was made in the scalp over the left hemisphere, exposing
the skull. A cooled (-70°C) 2 mm diameter stainless steel
probe was placed on the skull approximately 2 mm lateral of the
sagittal suture and 2 mm caudal of bregma for either 2, 5, 10,
or 20 s. Animals receiving sham surgery were treated identically
to those receiving a freeze injury except that the probe was
maintained at room temperature. After surgery, the scalp was
quickly sutured, subjects marked with ink injections to the footpads,
warmed under a lamp, and returned to the dam.
SUMC. Microgyria were induced as above, with the
following variations: Sprague-Dawley rats were used. Pups were
given freeze lesions on either P0 or P1. A copper probe with
a rectangular shaped tip (2 X 5 mm), cooled with isobutane in
dry ice was placed on the skull for 3–7 s. Controls were naïve
littermates of the same age.
Histology
BIDMC. On P15, P21 or P64, the animals were
anesthetized (pentobarbital 60 mg/kg) and perfused transcardially
with 0.9% saline followed by 4% paraformaldehyde. The brains
were removed and post-fixed for 24 h, cryoprotected with sucrose
buffer, frozen on dry ice, serially sectioned in the coronal
plane at 40 µm, and sections stored in 0.1 M sodium phosphate
buffer. Every tenth section was stained with Thionin for Nissl
substance and adjacent sections were reacted for parvalbumin
(see below).
The numbers of animals generated were as follows: P15 - 4 lesioned, 1 control; P21 - 6 lesioned, 2 control; P64 - 8 lesioned, 1 control.
SUMC. Procedures were as above, with the following
differences. After perfusion and immersion fixation in 4% paraformaldehyde
overnight, 40 µm coronal sections were cut with a vibratome.
A naïve sibling brain was processed simultaneously with
every freeze-lesioned brain. Every third section was taken for
parvalbumin staining, with adjacent sections stained for Nissl.
Eight P13 rats with sibling controls were used.
Nissl
Mounted sections were stained for Nissl substance with
0.05% Thionin using standard techniques.
Parvalbumin Immunohistochemistry
BIDMC. Free-floating sections were rinsed twice in phosphate buffered saline (PBS; pH 7.4) for five min each and transferred to a buffered 0.6% hydrogen peroxide solution in order to block staining of endogenous peroxidases. The sections were then rinsed twice in PBS and incubated overnight at 4°C in a 1/2500 dilution of mouse anti-parvalbumin immunoglobulin (ICN, Lisle, IL). The vehicle (diluent) for all antibody incubations was 3% rabbit serum in PBS with 0.3% Triton X-100.
Sections were then placed into a solution containing the linking antibody [rabbit anti-mouse immunoglobulin; Dakopatts (Santa Barbara, CA) Z259 - diluted 1/20] at room temperature for two h. The sections were rinsed twice with PBS and placed in a 1/250 dilution of mouse peroxidase anti-peroxidase (Dakopatts B650) at room temperature for two h. The tissue was rinsed twice in PBS, twice in 50 mM Tris buffer (pH 7.6), and developed using 0.05% diaminobenzidine and 0.005% hydrogen peroxide diluted in Tris. After rinsing with Tris, sections were mounted on chrome-alum coated slides, dehydrated, counterstained with Methyl Green/Alcian Blue, and coverslipped with Permount.
SUMC. Free-floating sections were processed
as previously described (6). Experimental
and control sections from the same anterior-posterior (a-p) level
were placed in the same well. The rabbit anti-mouse muscle parvalbumin
was kindly supplied by Dr. K.G. Baimbridge. A standard ABC kit
(Vector Labs) was used to visualize the antibody. Sections were
mounted on gelatin-coated slides, dehydrated, and coverslipped
with Permount.
Quantitative Analysis
All analyses were performed at BIDMC and sections
from both BIDMC and SUMC were treated identically. A primary
observer (GDR) measured all the sections and a secondary observer
(KMJ) measured a subset of these (4 experimental and 3 control),
sampling from all ages and from tissue processed in both locations.
For each lesioned subject in the study, measurements were taken
from one experimental section representing the antero-postero
(a-p) center of the lesion, and one control section matched to
the same a-p level.
ParvIR neurons were measured using a computer-assisted methodology (17). We counted the number of ParvIR neurons in three 200 µm columns in both the microgyric and control animals, as shown in Fig. 1. The microgyric column (MGc) was in the (medial-lateral) center of the microgyric cortex. The paramicrogyral zone column (PMZc) was 200 µm outside the border of the microgyric region, and the distal column (Dc) was located 2 mm to the PMZc in the direction away from the microgyrus. PMZc and Dc were placed either medial or lateral to MGc depending on the location of the microgyrus, so that Dc would lie within the neocortex of the lesioned hemisphere, and not in either entorhinal cortex laterally or past the midline medially. For the matched control sections, each of the counting columns were placed precisely in the region homologous to that counted in the microgyric subjects, by overlaying control and experimental sections.
Images were taken at 200X on a Zeiss Universal microscope (Carl Zeiss, Inc., Thornwood, NY), and projected onto a Sony GVM 1310 monitor (Sony Corporation, Park Ridge, NJ) that was connected to an Apple Macintosh Centris 650 workstation (Apple Computer, Cupertino, CA). A counting rectangle (CR; 200 µm X 250 µm) was overlaid on these images with the top of the CR aligned with the pial surface. On a digitizing tablet, ParvIR neurons were traced, with neurons touching the bottom and right side of the CR being omitted. The software kept track of both the number of neurons and their location (X and Y coordinates) in the CR. When all ParvIR neurons in the first CR were counted, the slide was moved such that the portion of the slide that was touching the bottom of the previous counting rectangle was now touching the top. Notation was then made that data from a second CR were being recorded. The ParvIR neurons were then counted in this CR as described above, and the procedure was repeated for each CR until the layer VIb/white matter border was reached. The Y coordinate for this border was noted.
After measurement of the Parvalbumin-stained material was completed, the adjacent Nissl-stained section was examined under the same magnification for the purpose of determining laminar borders. For MGc, the CR was placed in precisely the same area as MGc of the parvalbumin-stained section and fixed so that its top was aligned with the pial surface. The Y coordinate for each laminar border was then determined using the software as described above. For example, if the layer IV-V border was determined to be in the 4th counting box with a Y coordinate of 100, then the distance from the pial surface would be 850 µm 3 full CRs (750µm) plus 100 µm. From this measure, it was possible to normalize for total depth of the cortex at each counting site and express laminar borders as a percent of cortical depth. Using the example above, if the total cortical depth was 1800 µm, then the layer IV-V border would be at 47.22% of the depth of cortex. The Y-coordinates of the ParvIR neurons were then normalized in the same manner. In order to control for relative changes in the size of various lamina, a measure of ParvIR neurons was computed over a fixed laminar distance by dividing ParvIR number by the actual thickness (in µm) of the layer containing the neurons. This measure provides an indication of the relative density of ParvIR neurons within a given lamina and is expressed as ParvIR/20,000 µm2.
One obvious difficulty is the comparison of information from 4-layered microgyric cortex to that of 6-layered cortex (e.g., Fig. 2). Previous research had shown that mostly late-generated neurons comprise layer ii of the microgyrus and that the birthdates of these neurons correspond with those of layers II/III in normal cortex (2,8,18). Further, it is evident that at the time of the freeze lesions, all the neurons in the cortical plate underlying the freezing probe (layers IV-VIa) are destroyed, and that this necrotic region resolves into layer iii of the microgyrus, the so-called lamina dissecans (1). Often, but not always, layer VIb escapes damage from the freezing lesion and comprises layer iv of the malformation (Dvorák and Feit, 1977). With this information in mind, we matched data from 4-layered microgyric cortex to 6-layered normal cortex as follows: Stratum 1 = Microgyric layer i and normal layer I; Stratum 2 = Microgyric layer ii and normal layer II/III; Stratum 3 - Microgyric layer iii and normal layers IV, V, and VIa; Stratum 4 = Microgyric layer iv and normal layer VIb (Fig. 1).
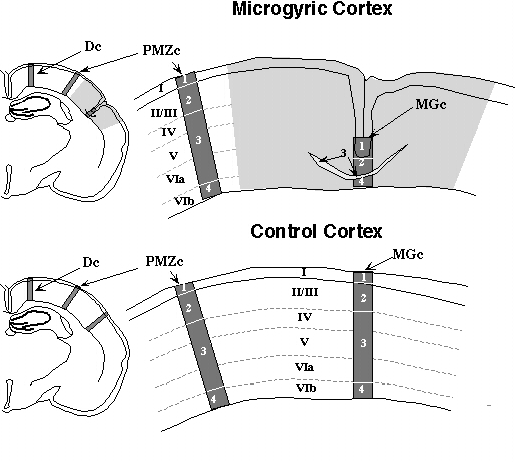 |
Figure 1. Schematic diagram illustrating methodology of ParvIR counts. The section containing the microgyric, four-layered region (grayed area) is matched to that of a control section. Columns in insets on left show sites within microgyric and control cortex from which counts were obtained. MGc: Microgyria column underneath the center of the microgyrus, usually under the microsulcus. PMZc: Paramicrogyral zone column, 200 µm outside the border of the microgyrus. Dc: Distant column, 2000 µm from the border of the microgyrus. ParvIR neurons were counted as described in the text. Uppercase Roman numerals: laminae of normal six-layered cortex. Lowercase Roman numerals: laminae of four-layered microgyric cortex. Arabic numerals: Strata of counting columns. Stratum 1: Microgyric layer i or normal layer I. Stratum 2: Microgyric layer ii or normal layer II/III. Stratum 3: Microgyric layer iii or normal layers IV, V, and VIa. Stratum 4: Microgyric layer iv or normal layer VIb. |
Data were analyzed by repeated measures ANOVA and Pearson
product-moment correlations.
RESULTS
Qualitative Analysis
Freeze injury to the developing cortical plate resulted
in a malformation resembling four-layered microgyria (Fig. 2). These malformations were located
in the architectonic regions HL, FL, Par1, Par2, and Oc1 (19),
and were rarely restricted to one region. More typically,
these lesions would traverse borders between two or more architectonic
areas (Fig. 3). Comparison
of lesioned brains to controls matched for architectonic location
controlled for these differences. For the BIDMC brains there
were variations in the severity of the lesion which were related
to the amount of time that the freezing probe was applied to
the skull (2-20 sec). Increases in the duration of the freeze
lesion were usually associated with deeper microsulci and/or
the formation of multiple microsulci. The microgyria generated
at SUMC were structurally similar to those generated with 5 s
lesions at BIDMC; typically a single microsulcus was surrounded
by ~600 m m of 4-layered cortex. These differences in the sizes
of the microgyri did not affect the overall findings, since the
counting column was always located either at the center of the
4-layered region or at a specified distance from the clearly
identifiable border of the microgyrus.
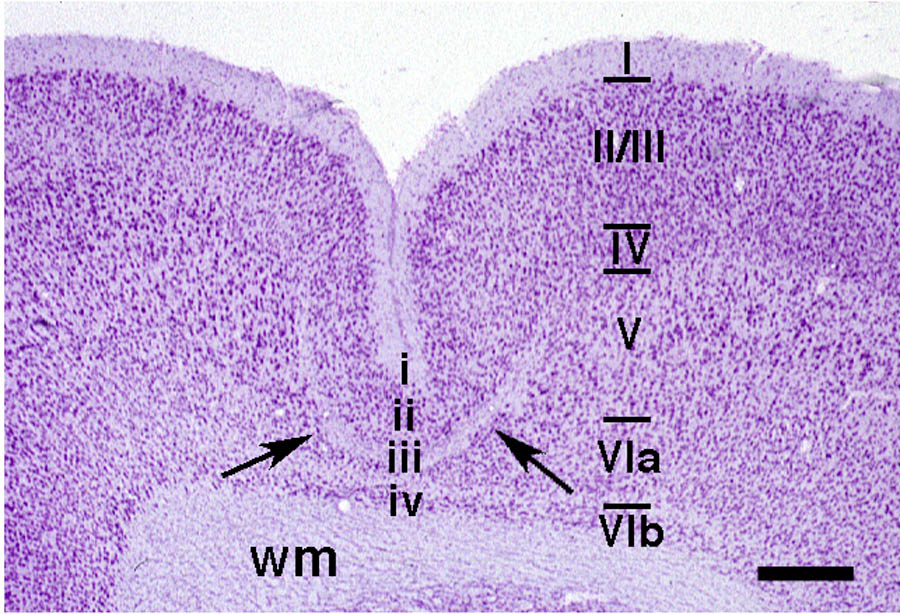 |
Figure 2. Photomicrograph of Nissl-stained section from cerebral cortex of a P64 rat illustrating typical microgyrus. In comparison to typical six-layered normal cortex (uppercase Roman numerals), the microgyric region contains 4 layers (lowercase Roman numerals). Arrows delineate the lamina dissecans (layer iii) of the microgyrus. Scale bar = 400 µm. wm = white matter. |
Examination of the brains of rats killed at P13 or P15 (N=12) supported previous observations (6) that there was a gross decrease in the numbers of ParvIR neurons in the microgyric cortex as compared to adjacent six-layered cortex, as well as compared to control cortex (Fig. 3 A,B,C,D). This was true for tissue generated at both BIDMC and SUMC. In contrast, by P21 (N=8) there was no obvious difference in the density of ParvIR between layer ii of the microgyria and layer II/III of adjacent, undamaged cortex or compared to layer II/III of controls (Fig. 3 E,F,G). These differences in ParvIR at P13–15 were present despite the fact that there was little change in the gross appearance and laminar composition of the microgyria between P13–15 and P21 (see Fig. 3A,E). The laminar pattern of ParvIR staining normally develops from an immature to a mature pattern during the second week of life (20,21). These changes include increases in the overall number of ParvIR neurons and density of ParvIR neuropil staining, and a change from a single dense band of neuropil staining within layer V to two bands of intense ParvIR neuropil, within layers IV and Vb, respectively (see Fig. 3). This developmental change in the laminar pattern was seen in cortex adjacent to the microgyrus, in contralateral cortex, and in control cortex, so that there was a general increase of all ParvIR neurons throughout the neocortex in the P21 animals compared to the earlier ages. In P64 rats (N=6), there was again no obvious difference in the density of ParvIR neurons in layer ii of the microgyrus as compared to layers II/III of adjacent six-layered cortex (Fig. 3 H,I,J), contralateral cortex, or cortex of control animals.
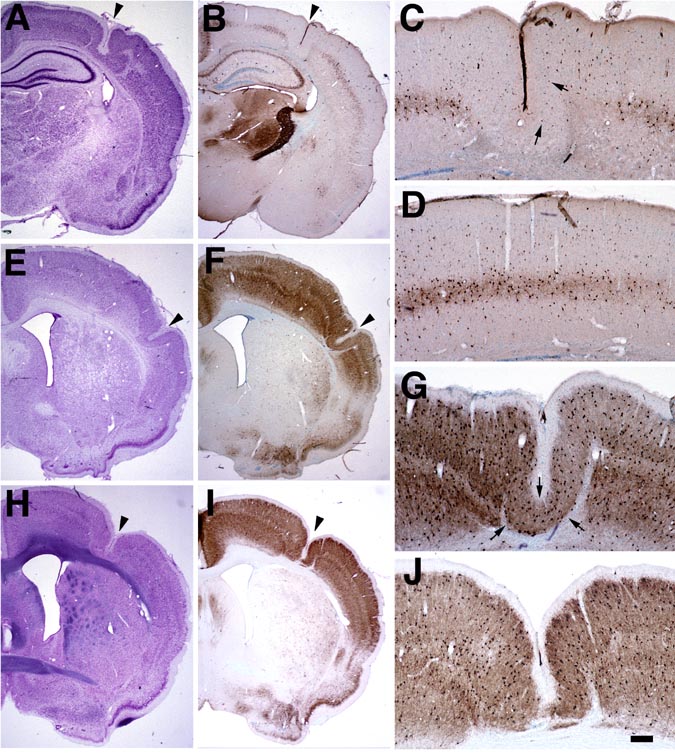 |
Figure 3. A-D. Photomicrographs from a P15 rat that received a freeze lesion on P1. Nissl-stained (A) and adjacent Parvalbumin-stained (B) sections from the left hemisphere. Arrowheads denote microsulcus. Higher power photomicrograph (C) illustrating the relative decrease of ParvIR neurons layer ii of the microgyrus (arrows denote ParvIR neurons) when compared to homologous region from a control brains (D). E-G. Photomicrographs of cortical sections from a P21 rat that received a freeze lesion on P1. Nissl-stained (E) and adjacent Parvalbumin-stained (F) sections from the left hemisphere. Arrowheads denote microsulcus. Higher power photomicrograph (G) illustrating no obvious change in the number of ParvIR neurons in layer ii of the microgyrus (arrows in G) compared to adjacent, undamaged cortex. H-J. Photomicrographs of cortical sections from a P64 rat that received a freeze lesion on P1. Nissl-stained (H) and adjacent Parvalbumin-stained (I) sections from the left hemisphere. Arrowheads denote microsulcus. Higher power photomicrograph (J) illustrating no obvious change in the number of ParvIR cells in layer ii of the microgyrus when compared to adjacent, six-layered cortex. Bar (in J) for panels A,B,E,F,H,I = 800 µm, for panels C,D,G,J = 200 µm. |
Quantitative Analysis
Preliminary Analysis
Interobserver reliability. There were 7 brains (4 experimental,
3 control) that were measured by two observers. Both observers
were blind as to the results of the other’s measures. A repeated
measures ANOVA used to determine the total-test reliability (22) yielded an rtt of 0.942, which was significant (P
<0.001). A Pearson product-moment correlation also showed
significant agreement between the two observers (r = 0.868, P<0.001).
These results support the reliability of the dependent measures.
Inter-laboratory differences. In order to test for any differences in the dependent measures between the two laboratories, a comparison was made between the P13 subjects from SUMC and P15 subjects of BIDMC (the only age where tissue from both laboratories was quantitatively analyzed). A series of two-way ANOVAs were performed with Location (BIDMC vs. SUMC) and Experimental Group (Lesion vs. Control) as the independent measures and the number of ParvIR neurons and the density of ParvIR neurons within each strata for each column as dependent measures. There were no significant Location effects for any variable (P > 0.05 in all cases). Thus, despite different antibodies and slightly different lesioning and sectioning techniques, there were no differences between the values derived from tissue from the different locations. For further analysis, location was therefore ignored.
Differences between P21 and P64 animals. Because qualitative analysis suggested that there were no differences in ParvIR between P21 and P64 animals, we performed a series of repeated measures ANOVAs in order to determine whether there were any quantitative differences between these two ages. In this analysis Age (P21 vs. P64) was a between measure and Column (MGc, PMZc, Dc) and Lesion (Lesioned vs. Control) were the within measures, with ParvIR/20,000 µm2 as the dependent measure. ANOVAs were computed separately for each of the 4 Strata. There were no significant interactive effects of Age with any of the other variables, so the subjects from P21 and P64 were pooled together as the “old” age group in the quantitative analyses described below.
Analysis of ParvIR neuronal density
From qualitative observations it was hypothesized that there would be a significant difference in ParvIR neurons/unit area for Stratum 2 of the microgyrus compared to Stratum 2 of control cortex in the P13–P15 (“Young”) group, and that this difference would not be apparent in the older animals. In order to test this hypothesis, a series of two-within, one between repeated measures ANOVAs were computed for the number of ParvIR neurons for each of the Strata. In these ANOVAs, Age (Young vs. Old) was the between variable with Column (MGc, PMZc, Dc) and Lesion (Lesion vs. Control) as the within variables and ParvIR/20,000 µm2 as the dependent measure. Strata 1 (the molecular layer for both lesioned and control animals) and 4 contained very few ParvIR neurons and no significant differences between any groups were found (see Table 1). The results of these analyses are summarized in Fig. 4 for Stratum 2 and Fig. 5 for Stratum 3.
Stratum 2. Overall, there was a significant effect of Age (F1,24 = 9.23, P< 0.01), Lesion (F1,24 =10.75 P< 0.001), and the interaction of these two variables (F1,24 = 17.63, P < 0.001). These results indicated that there was a greater concentration of ParvIR neurons in older animals in general, and that there was a significant difference between lesioned and control animals in the youngest age group (<P15), but there was no such difference in the older animals (>P21). Examination of the data from the individual Columns shows that this pattern holds for all Columns (Fig. 4). There was a significant effect of Column (F2,48 = 10.37, P< 0.001) indicating an overall greater density of cells in PMZc than in either MGc or Dc.
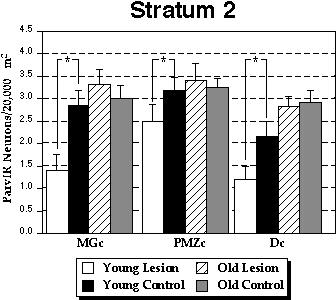 |
Figure 4. Summary of quantitative data for Stratum 2. Bar graphs show the density of ParvIR neurons/20,000 µm2 (+/-SEM) in microgyric and control rats. “Young”; rats were sacrificed at >P15 and “Old” rats were sacrificed >P21. *statistically significant difference (P < 0.05). |
Stratum 3. We expected to see significant differences between lesion and control groups in Layer 3 for MGc at all ages, since this is the region in which neurons are killed in the freeze-lesioned animals. The overall ANOVA revealed a significant effect of Column (F2,48 = 18.32, P < 0.001), Lesion (F1,24 =26.53, P < 0.001), and the interaction between these two variables (F2,48 = 28.23 P < 0.001). Further examination showed that there were in fact fewer ParvIR neurons in the lesioned animals relative to controls in MGc (F1,24 = 42.66, P <0.001) and PMZc (F1,24 = 9.98, P<0.01), but not in Dc (F1,24 = 1.04, NS). The findings in PMZc were unexpected, since that column is comprised of six-layered cortex outside of the microgyrus. These results suggest that there is a long-term decrease in expression of infragranular neuronal ParvIR in cortex immediately adjacent to microgyric regions, but not in distant cortex (Fig. 5).
 |
Figure 5. Summary of quantitative data for Stratum 3. Bar graphs show the density of ParvIR neurons/20,000 µm2 (±SEM) in microgyric and control rats. There were no differences between young and old rats, so their data are pooled. *statistically significant difference (P < 0.05). |
In order to determine which of the laminæ contributed most to this decrease in Stratum 3, the density of ParvIR neurons from the constituent layers comprising this Stratum (layers IV, V, and VIa) were evaluated for the PMZc. There was a significant decrease in ParvIR density in lesioned as compared to control animals in layer IV (F1,24 = 5.03, P<0.05), and layer V (F1,24 = 9.02, P<0.01), but not layer VIa (F1,24 <1, NS). These results are illustrated in Fig. 6.
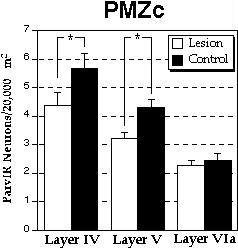 |
Figure 6. Density of ParvIR neurons/20,000 µm2 (±SEM) from Stratum 3 of paramicrogyral zone column (PMZc), showing numbers in layers IV, V, and VIa. *statistically significant difference (P < 0.05). |
DISCUSSION
These results demonstrate that the density of ParvIR neurons is low throughout most of neocortex ipsilateral to a microgyrus in immature rats, and that this decrease of expression of ParvIR persists in older animals only within layers IV and V immediately adjacent to the microgyrus. The findings will be considered in light of what is known about the ontogeny and modulation of parvalbumin immunoreactivity and other GABAergic markers in the cortex.
Control Tissue
The calcium-binding protein parvalbumin is expressed in subclasses of interneurons, and nearly 100% of these cells co-express GABA (23). In the developing cerebral cortex, ParvIR neurons are not seen until the end of the first postnatal week (21,24), however by P12 they are present in all cortical laminæ except layer I, and their distribution achieves a mature pattern by P21 (21). Examination of our control tissue confirms these findings. Specifically, we have seen a remarkable progression in the intensity of ParvIR in the neuropil and an increase in the density of ParvIR neurons between P13 and P21. The pattern achieved by P21 persists into adulthood until at least P64. Thus, control rats from our sample have an age-appropriate distribution of ParvIR neurons in the cerebral cortex, similar to that reported previously.
Transient Effects of Neonatal Freeze Lesions
The decrease in density of ParvIR neurons within the microgyric regions in P13–15 animals that had been apparent on casual examination of sections was confirmed with quantitative measures. In addition, a previously unappreciated decrease in ParvIR neuronal density in upper layers of regions located outside the area of the apparent malformation (PMZc and Dc) was found with quantitative measures. This decrease in superficial layers was not present in P21 or P64 animals, suggesting either a temporary down-regulation of parvalbumin immunoreactivity in microgyric cortex, or a delay in the maturation of ParvIR neurons. While data from the present experiment cannot distinguish between these two possibilities, there is evidence to support both ideas.
A temporary down-regulation could occur due to decreases in cortical activity. It has previously been demonstrated that parvalbumin and glutamic-acid decarboxylase (GAD) or GABA levels follow the level of afferent input to the cortex. For instance, decreases in sensory input to the cortex result in reduced immunocytochemical staining for parvalbumin and other GABA markers throughout the neocortical laminae (25–29), while an increase in sensory drive can result in a more intense level of GAD immunoactivity (30). In the current study, the most severe decrease in activity levels would be expected within the microgyrus proper, due to loss of layer IV through VI and their normal afferents, and it is in this zone that the largest decrease in ParvIR neurons was found. Preliminary anatomical findings demonstrating a near absence of thalamocortical input to the microgyria further support this idea (31). The later increase in parvalbumin may reflect a return of activity levels due to formation of connections between neurons intrinsic to the microgyrus and other compensatory developmental processes.
A second explanation for temporary decreases in ParvIR is a delay in neuronal maturation. Previous work has demonstrated that radial glia fibers are retained into adulthood within the area of the microgyrus following freeze injury to the cortical plate at P1 (4). These results suggest a maintenance of the immature state, at least within the microgyrus itself. There may also be some delay in migration and subsequent differentiation, since the upper limiting membrane is typically damaged by the freeze lesion, and the radial glia fibers take some time to regrow (4). In addition, stabilization of otherwise developmentally transient projections follows the induction of microgyria in cats (9,32). Maintenance of an immature state has also been demonstrated after other types of neonatal lesions. For instance, tectal lesions combined with transplant of tectal tissue to the spinal cord results in the preservation of projections from the visual cortex to the spinal cord that are normally transient during development (33). Also, lesions in rat ventroposterior thalamus at P7–8 result in transient alterations in the relative expression of parvalbumin and calbindin in neocortical interneurons (34). There is a normal sequence for expression of calcium binding proteins in some of these cells during the first three postnatal weeks involving shifts from calbindin, to calbindin plus parvalbumin, to parvalbumin alone (35,36). The thalamic lesion altered this sequence and caused a transient decrease in the number of parvalbumin-positive neurons and an increase numbers of calbindin-positive and parvalbumin-calbindin double-labeled neurons in neocortex (34). All three types of labeled neurons returned to control levels by the 3rd postnatal week, suggesting a delay in maturation rather than a permanent reduction in parvalbumin expression.
Changes in neuronal ParvIR remote from the lesion (Fig. 5) may be secondary to the maturational delay seen within the microgyrus. For example, these remote neurons may not receive required chemical or electrophysiological signals from the adjacent damaged regions, leading to a delay in expression of parvalbumin. Development of parvalbumin expression is thought to depend on the establishment of physiological synaptic activity (24). It is therefore possible that the temporary decrease seen in ParvIR neuron number results from a delay in the formation of cortical interconnections between the microgyral region and the adjacent paramicrogyral zone. Alternatively, the freeze lesion and subsequent re-organization of the cortex might result in the release of (a) factor(s) that act(s) to temporarily down-regulate the expression of parvalbumin in late-generated neurons.
Infragranular Effects of Neonatal Freeze Lesions in Older Animals
The large decrease in ParvIR cell number within Stratum 3 of the microgyrus was not surprising, since there is a marked depletion of all neurons in this region due to the freeze lesion. However, the significant decrease in ParvIR numbers outside of the microgyrus was unexpected. This change was specific to layers IV and V in the area just adjacent to the microgyrus, with no change at sites ~2 mm from the microgyrus. The spatial extent of changes in ParvIR is similar to the extent of cortex from which epileptiform activity can be evoked (6). While the functional effect of this decrease in parvalbumin has not been determined, a small concurrent reduction in releasable GABA in the same subset of neurons could contribute to the development of epileptiform potentials (e.g., a decrease in GABAA-receptor inhibition of only 10–20% promotes the genesis and spread of epileptiform potentials within normal cortex (37; but see 38).
There are a number of reports of anatomical abnormalities in the cortex surrounding the microgyrus, supporting the conclusion that aberrant development and reorganization occur in response to the loss of adjacent cortex. Glutamate immunocytochemistry has revealed disorganized axons in the paramicrogyral zone (3), where increases in GFAP and neurofilament immunocytochemical staining also occur (Jacobs, Parada and Prince, unpublished observations,3,4). Abnormalities in cytochrome oxidase and acetylcholinesterase staining adjacent to the microgyrus also suggest aberrant organization of thalamocortical afferents in this zone (39). A similar reorganization of intracortical axons (e.g., 40), if present, might result in enhanced recurrent excitatory circuitry and thus provide another important mechanism for epileptogenesis (41,42). The growth of most afferents into the cortex takes place in the microgyrus model after the lesion has occurred, thus suggesting that their aberrant organization is in response to the loss of adjacent cortical neurons rather than a direct effect of the lesion.
Widespread changes in cortical organization may arise as a result of the freeze lesion itself, or may be related to the more chronic effects of the malformed cortex on the remaining neocortex, such as epileptiform activity that may occur in vivo and propagate to remote cortical areas. Other types of lesions during development can result in abnormal connectivity that persists into adulthood. For example, in hamsters, neonatal lesions of the superior colliculus result in altered retinal projections (43–46), and unilateral removal of facial whiskers in newborn rats results in the maintenance of a normally transient cross-modal projection between the medial geniculate nucleus of the thalamus and somatosensory cortex (47). Interhemispheric callosal connectivity can also be enhanced as a result of critically timed insults (48,49) and may be a feature of microgyria as well (50).
Summary and Conclusions
The density of ParvIR neurons was determined at different postnatal ages in neocortex from normal and microgyric rats. In normal cortex, as previously reported, ParvIR increased and assumed an adult pattern by P21. The induction of microgyria by a freeze lesion to the cortical plate at P0 or P1 caused both transient more persistent effects on ParvIR in neurons of injured cortex. A transient decrease in the expression of ParvIR was found at P13–P15 in supragranular neurons both within the malformation itself and in six-layered cortex up to 2 mm adjacent to it, compared to control homotopic cortex. By P21, this difference in supragranular ParvIR neurons was no longer present. These results suggest that a delay in neuronal differentiation and synaptic maturation may occur in superficial laminae. The density of ParvIR neurons in laminae IV-VI was decreased focally within and adjacent to the microgyrus, compared to controls at all ages studied (P13#150;P64). The spatial and temporal extent of effects in lower cortical laminae was consistent with previously reported epileptogenesis associated with microgyri in this model. Taken together, these results support previous research demonstrating widespread changes in cortical architecture as a result of early freeze injury to the cortical plate.
Acknowledgements
The authors wish to acknowledge the technical support of Alison Frank and Isabel Parada. This work was supported, in part, by grant HD 20806 from the Public Health Service of the USA and by NIH grants NS09806 and NS12151 from the NINDS.
Table 1
| Stratum 1 | |||
|---|---|---|---|
| Groups | MGc | PMZc | Dc |
| Young Lesion |
|
|
|
| Young Control |
|
|
|
| Old Lesion |
|
|
|
| Old Control |
|
|
|
| Stratum 4 | |||
|---|---|---|---|
| Groups | MGc | PMZc | Dc |
| Young Lesion |
|
|
|
| Young Control |
|
|
|
| Old Lesion |
|
|
|
| Old Control |
|
|
|
There are no significant differences in either of these strata.