![]()
Note to the reader: This is a revised edition of a
paper published in Cerebral Cortex (1997;7:453–464). The
definitive original print version is available from Oxford University
Press.
New figures, text, and links have been incorporated
into the revision. Revised HTML (http://www.nervenet.org/netpapers/Rosen/MGN97/MGNRosen.html)
copyright ©1999 by Glenn
D. Rosen
CEREBRAL
MICROGYRIA, THALAMIC CELL SIZE, AND AUDITORY TEMPORAL PROCESSING
IN MALE AND FEMALE RATS
Amy E. Herman*, Albert M. Galaburda*, R. Holly Fitch,**, Alex R. Carter*, & Glenn D. Rosen*
*Dyslexia Research Laboratory and Charles A. Dana Research Institute, Beth Israel Deaconess Medical Center; Division of Behavioral Neurology , Beth Israel Deaconess Medical Center, Boston, MA 02115. **Center for Molecular and Behavioral Neuroscience, Rutgers University, 197 University Ave., Newark, NJ 07102.
Department of Neurology
Beth Israel Deaconess Medical Center
330 Brookline Ave
Boston, MA 02215
TEL: (617) 667–3252
FAX: (617) 667–5217
EMAIL: grosen@caregoup.harvard.edu
Induction of microgyria by freezing injury to the developing somatosensory cortex of neonatal rats causes a defect in fast auditory processing in males, but not in females. It was speculated that early damage to the cortex has sexually dimorphic cascading effects on other brain regions mediating auditory processing, which can lead to the observed behavioral deficits. In the current series of experiments, bilateral microgyri were induced by placement of a freezing probe on the skulls of newborn male and female rats, and these animals were tested in adulthood for auditory temporal processing. Control animals received sham surgery. The brains from these animals were embedded in celloidin, cut in the coronal plane and the following morphometric measures assessed: microgyric volume, medial geniculate nucleus (MGN) volume, cell number, and cell size, and, as a control, dorsal lateral geniculate nucleus (dLGN) volume, cell number, and cell size.
There were no sex differences in the cortical pathology of lesioned animals. However, microgyric males had more small and fewer large neurons in the MGN than their sham operated counterparts, whereas there was no difference between lesioned and sham operated females. There was no effect on dLGN cell size distribution in either sex. Microgyric males were significantly impaired in fast auditory temporal processing when compared to control males, whereas lesioned females exhibited no behavioral deficits. These results suggest that early injury to the cerebral cortex may have different effects on specific thalamic nuclei in males and females, with corresponding differences in behavioral effects.
Neuroanatomic anomalies of the forebrain have been associated with developmental dyslexia. Specifically, focal minor malformations of the cortex are seen in perisylvian and inferior prefrontal regions of both male and female dyslexic brains (1–3). In males, these malformations consist mostly of ectopic collections of neurons in the molecular layer and occasional focal microgyria; while ectopias are present in at least some females, their brains are characterized instead by the presence of large numbers of small myelinated glial scars. Molecular layer ectopias and microgyria can be induced in otherwise normal rodent brains by injury during late neocortical neuronal migration (4–11). Animals with either spontaneous or induced anomalies differ from their unaffected counterparts on a variety of behavioral measures (12–18) and consequently have provided insight into the anatomic/behavioral associations underlying developmental dyslexia.
Defects in the fast-processing of sensory information have been reported in dyslexics. Specifically, these subjects show deficiencies in fast, but not slow, visual processing (19–23). Livingstone et al. (23), for example, found slowed early visual evoked potentials to rapid, low-contrast stimuli, but a normal response to slow, high-contrast stimuli, suggesting a defect in the magnocellular system. Using functional magnetic resonance imaging, Eden et al. (24) showed decreased activation of visual area MT in dyslexics as compared to controls. Similarly, language-impaired children have difficulties in the fast processing of even non-linguistic auditory information, failing to distinguish stimuli presented in rapid succession (25, 26).
The relationship, if any, between the cortical anomalies and these defects in fast sensory processing is not yet known. Cytoarchitectonic and histological differences in the thalamus of developmental dyslexics, however, have suggested a possible link. Bilateral disruption of the cytoarchitecture of the medial geniculate (MGN) and the lateralis posterior nuclei of the thalamus has been reported in dyslexia (27). The origin of the cytoarchitectonic anomalies may be assigned to fetal life, probably coinciding with the period of neuronal migration to the thalamus. Changes in neuronal size, on the other hand, implicate a much longer developmental window. Thus, neurons in the magnocellular layers of the lateral geniculate nucleus (LGN) are smaller and there are more small (and fewer large) neurons in the left MGN of dyslexics, as compared to non-dyslexics (23, 28).
The presence of both cortical anomalies and thalamic changes in the same brain raises the possibility that they are related. For instance, one might hypothesize a developmental scenario in which defects in the thalamus propagate bottom-up, leading to neuronal defects in cortical areas—perhaps even cortical malformations. Alternatively, focal neocortical malformations may result in anomalies in the thalamus via a top-down cascade of neurodevelopmental influences. Cortical and thalamic anomalies may also originate independently, which would not, however, exclude additional changes resulting from top-down and bottom-up propagation between the two. At the outset, however, we wished to test the hypothesis that changes at one site (top or bottom) are associated with propagation to distant sites. Because in humans the cortical malformations appear relatively early (1, 29), we considered the top-down trajectory as a plausible one to explain the histological, if not the architectonic, changes seen in the thalamus. In the current report, we exploit an animal model of the auditory processing defect in an effort to test this hypothesis.
We have previously reported that male rats with induced microgyria have difficulty performing a fast, but not slow, auditory discrimination task when compared to unlesioned controls (30). Specifically, rats with bilateral microgyria were unable to perform a two-tone discrimination task when the total stimulus duration fell below 332 ms, a finding similar to that obtained in clinical studies of language impaired children (25). More recent studies have shown that female rats, unlike males, successfully perform the auditory discrimination task at all conditions, irrespective of whether or not they have induced microgyria (31). In both these studies, however, microgyria were induced in somatosensory (and to a lesser extent in frontal) cortex—brain regions that do not normally directly mediate auditory functions. We hypothesized that the effects of injury to the developing neocortex, irrespective of location, could propagate along transient or anomalous connections and across synapses and result in changes in areas important for low level auditory processing. Furthermore, the finding that males and females show different behavioral effects after comparable lesioning suggested to us that propagating (plasticity) effects are different in the two sexes. We further hypothesized that these cortical lesions in the male rat would affect cell sizes in the primary auditory thalamic nucleus, the MGN. In the present experiment, therefore, we measured MGN cell size, packing-density, and number in male and female rats with induced bilateral frontal, occipital, or parietal microgyria, which were also tested for auditory discrimination learning. To control for the possibility of a general thalamic effect, we also assessed these variables in the dorsal lateral geniculate nucleus (dLGN).
METHODS
Protocol
Pregnant Wistar rats were either obtained from Charles River Laboratories (Wilmington, MA) on gestational day 16–18 (E16–18), or females were bred in house. On the day of birth (P0) or at P1, animals were randomly designated to receive bilateral microgyria to either the frontal, parietal, or occipital cortex or to a sham condition. On P45, animals were shipped from Beth Israel Deaconess Medical Center (BIDMC) to the Center for Molecular and Behavioral Neuroscience for behavioral testing. At the completion of testing, the animals were perfused and their skulls returned to BIDMC, where the brains were processed for histologic and morphometric examination. The volumes of the microgyria and the MGN were determined bilaterally. Measures of cell size and cell packing density were performed in the MGN and dLGN using stereologic techniques and the total cell number of the MGN computed (see below).
Subjects
A total of five studies were conducted (see Table 1). The behavioral results from three of these studies have been reported elsewhere (30, 31). Microgyric animals were included in the current study if they received bilateral lesions and were not treated with the neuroprotective agent MK-801 (see Table 1).
Induction of Microgyria
Microgyria were induced based on a modification of a technique by Dvorák and colleagues (7, 8), and reported in detail elsewhere (4, 6). Pups were anesthetized with hypothermia, and a small incision was made in the anteroposterior plane of the skin over the midline, exposing the skull. For parietal lesions, a cooled (-70°C) 2 mm diameter stainless steel probe was placed on the skull over one or the other hemisphere (side randomly determined), approximately 2 mm lateral of the sagittal suture and 2 mm caudal of bregma, for 5 seconds. After placement of the probe, an identical lesion was placed in the opposite hemisphere. Animals receiving frontal or occipital lesions were treated identically except that the location of the probe was approximately 1 mm rostral of bregma (frontal) or 1 mm rostral of lambda (occipital). Animals receiving sham surgery were treated identically to those receiving freezing injury except that the probe was maintained at room temperature. After surgery, the skin was quickly sutured, subjects were marked with identifying ink injections to the footpads, warmed under a lamp, and returned to the mother.
Behavioral Testing
A more detailed description of the behavioral testing has been given elsewhere (30, 31). On P70, subjects were introduced to a modified operant conditioning apparatus for training sessions of 30 to 40 minutes per day until consistent performance was attained before being introduced to the auditory discrimination paradigm.
Testing consisted of a go-no go target identification task. Water-deprived subjects were exposed to an auditory stimulus that consisted of a two-tone sequence, and were required to indicate whether this stimulus was a “target” (reinforced), or a non-target sequence (not reinforced). A press following the subject’s target resulted in the presentation of water, while a press following a negative sequence resulted in a time-out of 45 s. The stimuli were generated by a Macintosh IIci computer, and were composed of two sine-wave tones 20 ms in duration, separated by an interstimulus interval (ISI) of 500 ms. The low tone was 1100 hertz and the high tone was 2300 hertz, presented at a supra-threshold intensity of 75 decibels as measured by a dB meter in the tube based on sound pressure level at all stimulus conditions. These stimuli were identical to those previously used to show a right ear advantage for auditory discrimination in adult male rats (32). Only Hi-Lo or Lo-Hi sequences were assigned as targets, and these were counterbalanced across animals and remained constant for each subject across testing sessions. Negative sequences included Lo-Lo, Hi-Hi, and the opposite mixed pair. Presentation of target and non-target stimuli in a test session was random with the constraint that half of the presentations be target (to maintain motivation), and that no more than three target or non-target sequences occurred in succession. Each daily session consisted of 48 trials.
After six days of testing at the above stimulus parameters (20 ms tone, 500 ms ISI, 20 ms tone), the ISI for all sequences (including targets and non-targets) was reduced to 350 ms. All other parameters, including the assignment of each subject’s target, remained constant. At the end of six days, the duration of the tones within the stimulus sequence was reduced from 20 to 16 ms each, and the ISI reduced from 350 to 300 ms. After another six days of testing the tone durations were reduced to 12 ms and the ISI to 225 ms for the final six days of testing.
For each test session the sequence of presentation on each trial, and the corresponding response type (hit, false alarm, correct rejection or miss) and latency to respond, were recorded. All phases of training were controlled by programs written in the software program LabView (National Instruments) specifically for this purpose.
Histology
After the completion of testing, rats were anesthetized with ketamine and xylazine and were transcardially perfused with 0.9% saline and 10% formalin. The heads were removed, placed in 10% formalin, and sent to BIDMC. The brains were removed from the skulls and placed into fresh 10% formalin for 7 days before being dehydrated in a series of graded alcohols and embedded in 12% celloidin. Serial sections were cut coronally in gapless sections at 30 or 40 µm. Series of every fifth section were stained with cresyl violet, mounted on glass slides and coverslipped with Permount.
Morphometry
Microgyric Volume. Using a drawing tube attached to a Zeiss Universal photomicroscope, the damaged area was traced starting from the first section showing any architectonic distortion and proceeding until the distortion unambiguously disappeared. Previous research demonstrated that the appearance of the area of damage with Nissl stains correlated quite well with assessment of damage as seen with various immunocytochemical stains, i.e., glial fibrillary acidic protein, glutamate, and neurofilament (4, 6, 33). The area of the damaged region was measured from these drawings using NIH Image v1.55 interfaced to a Power Macintosh 7500. Total microgyric volume was determined using Cavalieri’s estimation (34, 35). In rare situations where, because of missing or damaged sections, the equi-spaced criterion required for Cavalieri’s estimator was not met, a measurement method involving piece-wise parabolic integration was employed (35). The architectonic location of the lesion was also ascertained by overlaying the topographic location on a normalized flattened map of the neocortex derived from Zilles (36).
MGN Volume. Using the same drawing tube, the MGN was traced throughout its rostro-caudal extent. The area of the MGN and the estimation of volume was determined as detailed above for microgyric volume.
MGN Cell Measures. Cross-sectional cell areas and cell-packing densities were measured in the MGN of all rats using the modified dissector method and software of Williams and Rakic (37). We measured 3 fields on each of 3 slides, sampling from the rostral to the caudal extent and in the dorsal, ventral, and medial portions of the nucleus (38) of both hemispheres for a total of 18 fields per brain.
Images taken at 500X on a Zeiss Universal microscope (Carl Zeiss, Inc., Thornwood, NY) were projected onto a Sony GVM 1310 monitor (Sony Corporation, Park Ridge, NJ) that was connected to a Macintosh Centris 650 workstation (Apple Computer, Cupertino, CA). A counting square (95 µm X 85 µm) was overlaid on these images. Movement in the Z-axis was read by a Heidenhain MP-25 photoelectric micrometer (Heidenhain Corporation, Schaumburg, IL) interfaced to a National Instrument NB-GPIB card (National Instruments Corporation, Austin, TX) in the Macintosh. The base of the section was set to a Z-axis reading of zero. A red opaque overlay precluded cell counting below the confines of the optical box. As the plane of focus moved to 5 µm above the base, the screen became transparent. On a digitizing tablet, those neurons the nucleoli of which were in focus were traced. Neurons touching the top and right sides of the counting box were omitted. The screen turned opaquely green when the fine focus rose above 25 µm, precluding measurement of cells above the optical box. Thus, a perfect 20 µm thick slab of tissue was measured. Both the neuronal areas and cell packing density were recorded by the computer. Multiplying the MGN’s volume by its cell-packing density permitted estimation of the number of neurons in that nucleus.
dLGN Cell Measures. Cross-sectional cell areas and cell-packing densities were measured in the dLGN of all rats using the modified dissector method described above. Cells were measured on one field on each of 3 sections, sampling from the rostral to the caudal extent of the nucleus of both hemispheres for a total of 6 fields per brain. Multiplying the dLGN’s volume by its cell-packing density permitted estimation of the number of neurons in that nucleus.
dLGN Volume. Using the subjects from Study 4 (Table 1) the dLGN was traced throughout its rostro-caudal extent in an identical manner to that described above for the MGN. The area of the dLGN and the estimation of volume was determined as detailed above for microgyric volume.
Analysis
There were two independent measures: Sex (Male and Female) and Lesion (Frontal, Parietal, Occipital, and Sham). Anatomic dependent measures included MGN and dLGN cell size, cell numbers, volume, and microgyric volume. For the behavioral testing, a discrimination index (mean false alarm latency minus mean hit latency) for each six-day condition (defined by stimulus duration) was used as a dependent measure (30 for further discussion of this measure). Data were analyzed using ANOVA and Chi-square tests.
RESULTS
Preliminary Analysis
All animals with neonatal freezing lesions had neocortical malformations resembling microgyria (Fig. 1). There were no neocortical malformations in the brains of sham subjects. Examination of the 54 brains assigned to the lesioned condition showed that three had only unilateral damage (2 Frontal, 1 Occipital) and they were removed from the analysis. One subject with a purported parietal lesion was shown to have its lesion restricted to frontal region bilaterally and was categorized as such.
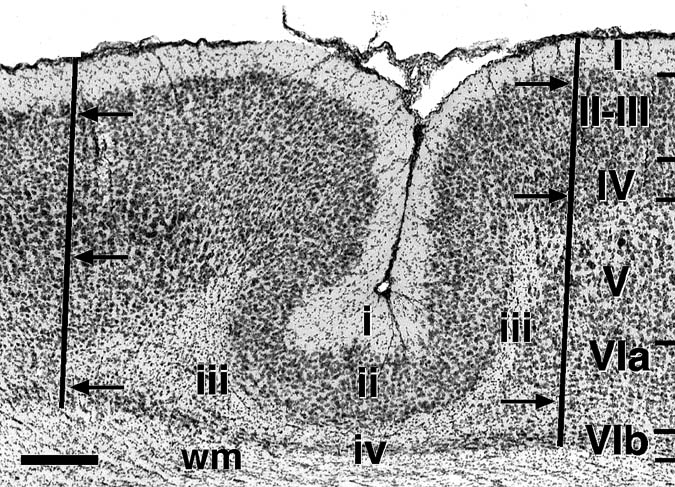 |
Figure 1. Low power photomicrograph of typical region of induced microgyria in the parietal cortex. In comparison to the adjacent, undamaged cortex (right) with six layers, microgyric cortex has 4 layers. Layer i is contiguous with the molecular layer of the undamaged cortex, layer ii is contiguous with layers II and III of undamaged cortex, but is unlaminated. Layer iii (lamina dissecans) is a glial scar that is the remnant of the original injury, and layer iv is contiguous with layer VIb of intact cortex. Solid lines denoted by arrows show the medial and lateral borders of the microgyric area for the purposes of determining microgyric volume. The dorsal border is the pial surface and the ventral border is defined by the border between the white matter (wm) and layer iv of the microgyria. Bar = 300 µm. |
Histology
The appearance of microgyria in animals exposed to freezing injury early in life was identical to that reported in previous work (4, 6). The location and mean volume of the microgyri are depicted in Figs. 2 and 3. There was no difference in volume of the parietally-lesioned cortex between males and females (F1,40 < 1, ns). Among males, there was a difference in microgyric volume among parietal, occipital, and frontal lesions (F2,26 = 5.74. P < 0.01) with parietal lesions being larger than either frontal or occipital lesions (Fisher PLSD, P< 0.05). Although smaller in volume, the microgyric formation present in occipital and frontal cortices was identical to those seen in parietal cortex and resembled those depicted in Fig. 1. For parietally-lesioned males and females, the degree of greatest lesion overlap occurred in Par1 (primary somatosensory cortex) or at the border of Par1 with HL (hindlimb region) and FL (forelimb region). Animals receiving frontal or occipital lesions had damage relatively restricted to the target area. One lesion in each hemisphere impinged on the posterior Rs (retrosplenial cortex) occipitally, while there was some damage of the rostral parietal cortex in the right hemisphere.
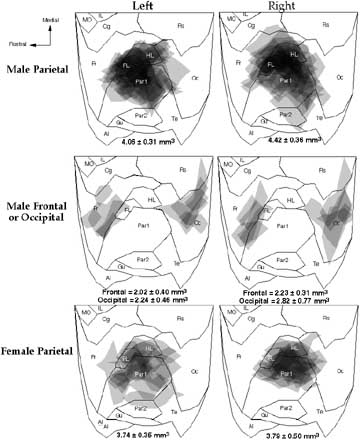 |
Figure 2. Topographic location of freezing lesions from the left and right hemispheres of rats plotted on a flattened, normalized map of the neocortex derived from Zilles (36). Each lesion is plotted and areas where lesions overlap are indicated by progressively darker shades of gray. The means ± S.E.M. (in mm3) for the volume of the microgyri are found below each map. Abbreviations: AI - agranular insular (includes dorsal, posterior, and ventral part); Cg - cingulate cortex (included Cg1-3); FL - forelimb area; Fr - frontal cortex (includes areas Fr11, Fr2, and Fr3); Gu - gustatory cortex; HL - hindlimb area; IL - infralimbic area of the medial frontal cortex; MO - medial orbital area; Oc - occipital cortex (includes all subdivisions of Oc1 and Oc2); Par1 and Par2 - primary and secondary somatosensory cortices, respectively; RS - retrosplenial cortex (includes granular and agranular subdivisions); Te- primary auditory cortex, and temporal areas 2 and 3. |
 |
Figure 3. A. Serial sections taken from the right hemisphere of rat exposed to a freezing lesion on P1 illustrating a large malformation. The arrowheads indicate the medial and lateral borders of the malformation. In this case, the lesion encompasses 8.26 mm3. The sections are separated by 600 µm in the rostral/caudal axis. Bar = 800 µm. B. Serial sections taken from the right hemisphere of rat exposed to a freezing lesion on P1 illustrating a small malformation. The arrowheads indicate the medial and lateral borders of the malformation, and the arrows indicate cell free, gliotic regions similar to those seen in layer iii of more typical microgyria (see Fig. 1). The lesion encompasses 0.72 mm3. The sections are separated by 300 µm in the rostral/caudal axis. Bar = 800 µm. C. Photomicrograph of medial geniculate nucleus (MGN). Solid line illustrates the outside border of the MGN. The three subnuclei of the MGN are indicated. Hipp = Hippocampus. Bar = 200 µm. D. Photomicrograph of dorsal lateral geniculate nucleus (dLGN). vLGN = ventral lateral geniculate nucleus, Hipp = Hippocampus. Bar = 200 µm. |
Morphometry
Because there were three different lesion locations in male
subjects, we first determined whether there were any differences
in the morphometric measures among these three lesion groups.
There was no difference in MGN cell area (F2,26 = 1.58, ns),
dLGN cell area (F2,26 = 1.68, ns), MGN volume (F2,26 = 2.10,
ns), or MGN number (F2,26 = 2.96, ns) among the three lesion
locations and so their data were pooled for further analysis.
There were significant differences among the lesion groups in
dLGN volume and number which are discussed in more detail in
the section entitled Assessment of Thalamic
Degeneration Following Freezing Injury below.
A two-way ANOVA with Sex (Male vs. Female) and Experimental Group (Lesion vs. Sham) as the independent measures showed a significant effect of Sex for all dependent measures. Females had smaller MGN volumes than males (X ± SEM = 0.52 ± 0.01 µm3 vs. 0.62 ± 0.01 µm3, respectively; (F1,88 = 15.45, P < 0.001), smaller MGN cell areas (93.65 ± 1.21 µm2 vs. 104.21 ± 1.17 µm2, respectively; F1,88 = 16.19, P < 0.001), smaller dLGN cell areas (84.29 ± 1.11 µm2 vs. 89.66 ± 1.20 µm2, respectively; F1,88 = 6.13, P < 0.05), and fewer MGN neurons (45,647 ± 1,866 vs. 52,836 ± 1,081, respectively; F1,88 = 7.35, P < 0.01). There were no other main effects or interactions for any variable.
In order to assess the distribution of neuronal sizes in the MGN, we determined the frequency distribution of neurons in each of 12 consecutive bins increasing by 15 µm2 and ranging from 35 µm2 to > 200 µm2. Chi-square values were calculated for the distribution of cells in these bins between lesioned and sham males, and lesioned and sham females. To compensate for the sensitivity of this test, we set a = 0.001 for rejection of the null hypothesis. The distribution of MGN neuronal sizes differed among males, with the lesioned animals having more small and fewer large neurons (chi2 = 49.30, df = 11, P < 0.001). The distribution of MGN neuronal sizes between lesioned and sham females, on the other hand, did not differ (chi2 = 14.85, df = 11, ns). Likewise, there was no difference in the distribution of dLGN cell sizes in both males (chi2 = 19.04, df = 11, ns) and females (chi2 = 19.49, df = 11, ns). These results are summarized in Fig. 4.
 |
Figure 4. Cumulative percent of MGN (top) and dLGN (bottom) cell sizes in all four experimental groups. In the MGN, note the nearly total overlap of distribution of the female lesioned (red line) and sham (green line) distribution, In comparison, the distribution of the male lesioned MGN cells (pink line) is significantly deviated toward the left (i.e., smaller) when compared with male shams (blue line). In the dLGN, there is no difference in the distribution of cell sizes within females or males. Finally, in both the MGN and dLGN, the distribution of cell size among females is significantly different than males, with females having more small and fewer larger cells. |
An objection could be raised that a few subjects with large numbers of cells could bias the above Chi-square analysis by skewing the distributions for the group as a whole. For example, a few lesioned male subjects with large numbers of small cells could shift the distribution of the entire population to the left. To correct for this, we computed the percent distribution of cells for each subject individually using the same 12 bins as described above and derived a mean percent frequency distribution for each of the four groups. Knowing the total number of cells measured for each group, we computed an “unweighted” distribution of cell sizes by multiplying the percentage for each bin by the total cell number. These unweighted distributions were then compared by Chi-Square analysis. As before, lesioned males had more small and fewer large MGN neurons than shams (chi2 = 68.07, df = 11, P < 0.001), while females showed no differences between groups (chi2 = 20.14, df = 11, ns). For the dLGN, there were no differences between the lesioned and control groups among males (chi2 = 16.67, df = 11, ns) or females (chi2 = 20.01, df = 11, ns).
Finally, we wished to determine whether the significant difference in the distribution of cell sizes in the MGN of males was related to one or more of the regions of the MGN. An ANOVA using Sex and Lesion as the independent measures and the dorsal, ventral, and medial subdivisions of the MGN as repeated measures yielded a significant effect of Sex (F1,88 = 16.01, P < 0.001) and of MGN Region (F2,176 = 61.20, P < 0.001). This effect of Region was attributed to the fact that cells in the ventral nucleus were smaller than those in both the dorsal and medial nuclei (see Fig. 5). There were no significant interactions.
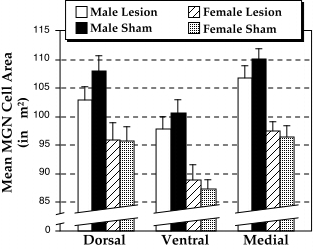 |
Figure 5. Mean MGN cell area for each of the three subnuclei of the MGN. Cells in the ventral nucleus are smaller than those in either the dorsal or medial nuclei. In addition, cells from females are smaller than those in males in each of the nuclei. Note the similarity between experimental groups within each of the nuclei. |
In order to test the distribution of the MGN cells in these subnuclei, we performed the same Chi-square analysis described above within each subnucleus of the MGN. There was no difference in MGN cell size distribution for any region in females (ventral chi2 = 16.09; dorsal chi2 = 12.29; medial chi2 = 17.06, df = 11, ns). Lesioned males had more small and fewer large cells in the dorsal subnucleus of the MGN (chi2 = 36.90, df = 11, P < 0.001). There was no significant difference in the distribution of cells sizes in the ventral (chi2 = 17.41, df = 11, ns) or medial (chi2 = 24.16, df = 11, ns) subnuclei, although a trend was noted in the same direction as in the dorsal subnucleus (Fig. 6).
 |
Figure 6. Cumulative percent of cell sizes in each of the three subregions of the MGN for each of the four experimental groups (see Fig. 4 for comparison). For each nucleus, there is no difference in the distribution of cell sizes between female lesioned and shams. For the males, there was a significant difference between lesioned and sham cells sizes for the dorsal nucleus. The differences in the ventral and medial nuclei, while not significant, are in the same direction and there is no overlap of the distribution in either nucleus. The distribution of cell size among females is significantly different than males, with females having more small and fewer larger cells for all subregions of the MGN. |
Behavior
Previous results had shown that males with microgyria were unable to perform the auditory discrimination task at the shorter stimulus durations (<350 ms) whereas male shams could (30). In contrast, lesioned females perform as well as their unlesioned counterparts at all stimulus conditions (31) We examined the behavior in our sample, which included a subset of subjects from previously published experiments (see Table 1). An overall repeated measures ANOVA with Experimental Groups and Sex as the between factors and Condition, Day, and Response type (False Alarm/Hit) as within factors was performed. A significant main effect was found for Sex, with males performing worse than females (F1,88 = 8.40, P < 0.01). There was a significant interaction among all within and between variables (F15,1320 = 1.809, p < 0.05). Post-hoc analysis showed that female shams successfully performed the discrimination at all stimulus conditions as measured by significantly longer false alarm as compared to hit latencies, with the exception of Condition 1 (see Ref 31 for a detailed discussion of this finding). Lesioned females, and sham and lesioned males, also showed significant discrimination at all conditions. Further analysis showed that there were no differences between lesioned and sham females at all conditions, whereas lesioned males performed significantly worse than shams only at Condition 4, the fastest condition (F1,66 = 3.01, p < 0.05, one-tailed; see Fig. 7). These results are consistent with prior reports from behavioral studies (30, 31).
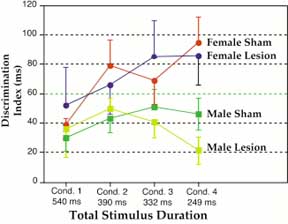 |
Figure 7. Mean discrimination index, as calculated by the false alarm minus hit difference (in ms), for male and female lesioned and sham groups at the 4 stimulus duration conditions. The numbers under each condition are total stimulus time (pre-tone/ISI/post-tone). Discrimination indices are mean scores over 6 days of testing at each condition. |
Assessment of Thalamic Degeneration Following Freezing Injury
Measurement of cell size distribution showed no changes in the dLGN after frontal, parietal, or occipital cortex lesion. In contrast, lesions of either the frontal, parietal, or occipital cortices had significant effects on cell size distribution in the MGN. We expected some effects in the dLGN after occipital cortical lesions as suggested by the literature. We therefore compared the volumes and total cell numbers of the dLGN and MGN from the study that contained all three lesion groups (Study 4). MGN volume and total cell number was no different among the three lesion groups and was also no different from the shams (F3,17 =1.20, ns; F3,17 = 1.43, respectively) indicating that there were no degenerative effects of the freezing injury to frontal, parietal, or occipital cortex on the MGN. In contrast, lesions to the occipital cortex significantly reduced the volume and cell number of the dLGN in comparison to the lesion groups and in comparison to controls (F3,17 = 12.68, P < 0.001; F3,17 = 11.11, P < 0.001, respectively). These results are summarized in Fig. 8.
 |
Figure 8. Mean ± SEM of nuclear volume and total cell numbers of the medial (MGN) and dorsal lateral (dLGN) geniculate nucleus of male lesioned and control animals from Study 4 (see Table 1). There are no differences among frontal (white), parietal (black), and occipital (hatched) and shams (gray ) in the MGN. In the dLGN, the occipitally-lesioned animals have significantly smaller volumes and fewer cell numbers in comparison to the other three groups (P < 0.001). |
DISCUSSION
Distribution of Cells in the MGN
There were no differences in mean MGN cell size between lesioned and sham animals of either sex. When the distribution of cell sizes was examined, however, it was found that lesioned males had more small and fewer large cells (Fig. 4). There was no difference in cell distribution between lesioned and sham females. When this analysis was broken down further by MGN subnuclei, lesioned males had more small and fewer large neurons in all nuclei of the MGN, but significantly so only for the dorsal nucleus. Finally, there were no differences in either the mean value or cell size distribution of dLGN neurons between lesioned and control animals, males or females. Thus, the cortical injury does not produce similar changes in all thalamic nuclei.
These findings raise two questions: (1) How can microgyria affect cell size distribution in the MGN? and (2) Why is the effect seen only in males?
We have previously noted in the brains of developmental dyslexics the presence both of molecular layer ectopias and changes in cell size in the LGN and MGN (2, 23, 28). The molecular layer ectopias appear predominantly in the left hemisphere and in inferior pre-frontal and perisylvian (including auditory association) cortices (2). Molecular layer ectopias are thought to result from injury to the developing cortical plate occurring before the end of neuronal migration. We hypothesized that the injury that causes the ectopias, or the malformations themselves, triggers a top-down propagation of changes, which explains the changes in the thalamus.
The current findings lend some support to this hypothesis. First, it is unlikely that the change in cell size distribution of the MGN in males is the result of direct damage to thalamic regions by the freezing lesion or of expansion of the pathology to cortical areas overlying the thalamus. The focal area of microdysgenesis following this type of neonatal injury is restricted to the cerebral cortex both acutely (6) and chronically (4). In addition, the MGN is both more lateral and substantially caudal to the injured cortical areas, making it unlikely for it to have been involved in the damage, even acutely. Further, the lack of an apparent effect on cell size of the dLGN, a structure lying immediately rostral and dorsal to the MGN and therefore closer to the damaged cortical regions, supports this notion. Thus, the relationship between MGN cell size and microgyria can be explained neither by direct effects of injury on the thalamus nor by extension to other cortical structures overlying the thalamus. Instead, the evidence points to indirect effects of neocortical injury on the cell size distribution of the MGN.
One conduit for propagation of changes could be neuronal connections. Connections between the injured area and the thalamic target could be (1) monosynaptic, (2) polysynaptic, (3) permanent normal connections, (4) transient normal connections, or (5) transient or permanent abnormal connections resulting from sprouting. There is no evidence of direct connections between the cortical areas lesioned and the MGN, and we have seen no change in either MGN volume or cell number associated with the lesions. On the other hand, there are direct connections between the occipital cortex—a region lesioned in 5 of the animals in this study—and the dLGN, and while there were degenerative changes in the dLGN after occipital lesions, there were no changes in cell size distribution. Therefore, we conclude that monosynaptic deafferentation of thalamic nuclei following cortical lesions of the type described here results in atrophy of the nucleus and fewer neurons, while polysynaptic effects concern the distribution of cells sizes.
Developmentally, there are transient direct connections from the MGN to the somatosensory cortex. Moreover, unilateral removal of facial whiskers in newborn rats results in the maintenance of this transient cross-modal projection (39). Maintenance of otherwise transient projections also follows the induction of microgyria in cats by injection of ibotenic acid into the developing visual cortex (40, 41). Furthermore, widespread brain reorganization has been reported following a variety of developmental injuries by abnormal sprouting. In hamsters, for example, neonatal lesions of the superior colliculus result in altered retinal projections (42–44). Neonatal ischemia, induced by bilateral carotid ligation in cats, results in an excess of callosal projections from visual areas 17 and 18 (45). Finally, an increase in callosal connectivity has been seen in a case of spontaneous microgyria in the rat (46). In summary, hypoxic-ischemic insults that result in microgyria may disrupt standard patterns of neuronal connectivity by maintenance of transient projections (39, 41), or from the invasion of vacated terminal space by sprouted axons from new undamaged regions (42).
It is possible, therefore, that early freezing injury produces microgyria with normal and abnormal efferent and afferent connectivity, which could provide the conduits for the propagation of cascading effects on structures thus connected to this region. The abnormal connectivity could theoretically be the result of the pathological maintenance of normally transient connections or the formation of novel connections. Therefore, propagation of effects which are manifested at the histological level may take place along multiple pathways (mono- and polysynaptically), varying according to the details of the history of connectivity. Although propagation of changes along standard connections would be easily traced, changes propagated via transient or anomalous connections require special experimental demonstration. That the effects seen in the current report reflect changes in one thalamic nucleus and not another point the way toward future investigations of this hypothesis.
Sex Differences
While lesioned males had more small and fewer large cells than their unlesioned counterparts, there was no difference between lesioned and unlesioned females. This sex difference is of particular interest in light of the claims that dyslexia is up to three times more common in males than females (47, 48) but see, c.f., Shaywitz et al., (49). In fact, evidence indicates that males are preferentially afflicted with virtually every neurodevelopmental and psychiatric disorder of childhood, including mental retardation, autism, hyperactivity, dyslexia, epilepsy, and cerebral palsy (50). However, the fact that the MGN cells were smaller overall in females than in males may indicate a floor effect. Specifically, it could be that there is little room for a shift in the distribution to the left (i.e., toward smaller neuronal size) for the lesioned females because the entire population is shifted significantly in that direction with respect to the males. At present, we cannot exclude this possibility.
If this finding is not due to a floor effect, then it could be that the female brain is more resistant to injurious agents. In animal studies, for example, it has been shown that female gerbils show less injury from ischemic challenges than males (51). We found, however, no difference in lesion size between males and females, indicating an equivalent response to the injury, at least acutely. We may argue, then, that males and females have a different delayed response to the lesion. For example, females are less susceptible behaviorally to the effects of early neocortical damage (52). Alternatively, the possibility exists that sex differences in maturation and/or plasticity timing of brain regions could play a role. Thus, Goldman et al. (53) reported that male monkeys whose orbital prefrontal cortex had been removed in infancy were impaired at an object discrimination reversal task at two and a half months of age, while lesioned females did not show a behavioral deficit until approximately 1 year later. They hypothesized that sex differences in the development of cortical regions could have implications not only for the acquisition of behavioral and cognitive skills, but also for the higher incidence of developmental disorders in males.
The male/female differences in the current study are intriguing. Clearly, there exist differences in the normal state vis à vis cell size between the sexes, but also response to injury may be dampened in the female by an as yet unidentified factor or factors. One other possibility that deserves consideration is that the presence of circulating testosterone during the time of injury in the male rats might exacerbate cerebral plasticity such that there is an enhanced re-organization of the brain. Thus, research has shown that estrogen acts to regulate various neurotrophic receptors (54, 55). These findings suggest the possibility that the developing male brain is “hyper-plastic” and therefore reacts to early injury to a greater extent—with perhaps more deleterious effects—than does the female brain. Further empirical research will help resolve these issues.
MGN Subnuclei
As discussed above, the MGN can be divided into three subnuclei —dorsal, ventral, and medial. Each of these nuclei have their own sets of afferent and efferent connections and are composed of overlapping yet different cell types (38). We found that there were differences in cell size among these three subnuclei, with cells in the ventral nucleus being smaller than those in either the dorsal or medial nuclei. Further, we found that the distribution of dorsal nucleus cell size was significantly different between lesioned and sham males, whereas the distribution of ventral and medial cells sizes in these groups was not. It should be noted however, that the direction of the distribution in these latter two nuclei were in the same direction, although not significantly so. Moreover, we found no difference among the various nuclei in their correlation with behavior. Taken together, these data suggest that the effects of early freezing injury to the cortical plate on cell size in the male MGN are not restricted to one subnucleus but are pervasive.
Summary and Conclusions
Previous research had indicated that freezing injury to the presumptive somatosensory cortices of rats induces cerebrocortical microgyria and was associated with a defect in fast auditory processing (30). What remained unexplained in that study was how this cortical damage could affect auditory discrimination as there is no evidence that these cortices play a significant role in auditory processing in this animal.
In the current study we have demonstrated that freezing injury to the cortical plate in males significantly affects the distribution of cell sizes in the MGN. Specifically, microgyric males have more small and fewer large neurons in the MGN than their unlesioned counterparts, and lesion location played no role on this measure. This was seen in all subnuclei of the MGN, although only the dorsal nucleus showed significant differences. Further, lesioned males were significantly impaired in their ability to perform a fast auditory discrimination in comparison with their sham littermates, and MGN cell size (overall and in all subnuclei) correlated with behavior at the fastest condition. In contrast, lesioned females did not differ from sham littermates in either anatomy or behavior. We hypothesize that early injury to the cortical plate causes histological changes at distant sites, explained by propagation along connectional pathways, some of which may be only transient connections, others anomalous connections. Further, there are gender factors that separate males and females in this response. Future research aims to delineate further the sex differences, as well as the connectional pathways associated with early freezing injury to the cortical plate.
ACKNOWLEDGMENTS
This work was supported, in part, by PHS grant HD20806, by
a grant from the New England Branch of the Orton Dyslexia Society,
and by a grant from the McDonnell-Pew Charitable Trusts to RHF.
The authors wish to thank Dr. P.S. Goldman-Rakic for the use
of the software for the cell measurement, Dr. G.F. Sherman for
his helpful comments, and the anonymous reviewers for their careful
reading of earlier versions of the manuscript.
Acknowledgments also go to Lisa Stone Garcia, Alison Frank, and
Heinz Windzio for technical assistance.
Table 1
Subjects from 5 consecutive studies used in current experiment
| Study 1 (30) | Male Parietal | X |
| Male Sham | X | |
| Male Right | ||
| Male Left | ||
| Study 2* (31) | Male Parietal | X |
| Male Sham | X | |
| Male Parietal + MK-801 | ||
| Male Sham + MK-801 | ||
| Study 3 (31) | Male Parietal | X |
| Male Sham | X | |
| Female Parietal | X | |
| Female Sham | X | |
| Study 4 | Male Parietal | X |
| Male Sham | X | |
| Male Frontal | X | |
| Male Occipital | X | |
| Study 5 | Male Parietal | X |
| Male Sham | X | |
| Female Parietal | X | |
| Female Sham | X |
One parietal lesion was determined to be frontal on post-mortem examination
*N = 5 for shams in Study 1
ÝMK-801 = treatment with MK-801 (3 X 2 mg/kg) at P1.