Note to the reader: This is a revised edition of a
paper published in Neuroscience & Biobehavioral Reviews (1996;20:607–615).
The definitive original print version is available from Elsevier
Press.
New figures, text, and links have been incorporated into the revision. Revised HTML (http://www.nervenet.org/netpapers/Rosen/AsymRev96/AsymRev.html) copyright ©1999 by Glenn D. Rosen
CELLULAR, MORPHOMETRIC, ONTOGENETIC AND CONNECTIONAL SUBSTRATES OF ANATOMIC ASYMMETRY
Glenn D. Rosen
Dyslexia Research Laboratory, Beth Israel Deaconess Medical Center; Division of Behavioral Neurology , Department of Neurology, Beth Israel Deaconess Medical Center, 330 Brookline Avenue, Boston MA 02215; Harvard Medical School, Boston, MA 02115.
Department of Neurology
Beth Israel Deaconess Medical Center
330 Brookline Avenue
Boston, MA 02215
USA
Phone: (617) 667–3252
FAX: (617) 667–5217
Email: grosen@caregroup.harvard.edu
Although anatomic cerebral asymmetry appears in all animals that have been examined, its link to functional lateralization is not clear. In an attempt to further elucidate this relationship between structure and function, we have compared, in rats and humans, brains that have asymmetric architectonic areas to those that are symmetric. We have found that (1) asymmetry is the result of the production of a small side rather than the production of a large side; (2) architectonic asymmetry is the result of changes in the total numbers of neurons rather than cell-packing density; (3) events occurring early in corticogenesis—specifically during the period of progenitor cell proliferation and/or death—are important for the formation of asymmetric cortical areas; and (4) symmetric brains have relatively greater numbers of callosal fibers and more patches of termination than their asymmetric counterparts. These results, taken together, suggest that if anatomic asymmetry underlies functional lateralization, it may have more to do with the different organization of symmetric and asymmetric brains, rather than simply which hemisphere (or brain region) is larger.
From the time of Broca’s (1) report of left hemisphere infarct leading to a disturbance of speech, the study of lateralization of function has grown to be an active area of investigation. It is generally accepted that in humans the left hemisphere is specialized for the processing of some aspects of language while the right hemisphere dominates over many spatial, emotional, and musical functions (2) but see also (3). It is also believed that lateralization of function is present from birth (4–6). Because of the obvious lateralization of speech and language, the search for its biological substrates and has mostly centered around the classical language areas. Geschwind and Levitsky (7) measured the lateral border of the planum temporale, a region on the posterior portion of the superior temporal sulcus which contains auditory association areas, and found that 65% of the brains they examined had a larger left planum whereas only 11% had the reverse asymmetry (24% showed no bias). Asymmetry in this region has been replicated by additional measurements by a number of different laboratories using postmortem and non-invasive techniques (8–17). Furthermore, asymmetries have been documented in young brains, with 56%-79% of the fetuses or infants measured having a larger left planum (10,11,13). Cytoarchitectonic areas Tpt (an auditory association cortex located partially within the planum temporale) and PG are larger on the left, and their asymmetry directly relates to planum asymmetry (18,19).
Lateralization of function and anatomic asymmetry are not limited to humans, however. Passerine birds produce song predominantly with their left hemisphere (20–23), and Japanese macaques have a right ear advantage for the processing of species-specific vocalizations (24). In the rat, the right hemisphere is purported to be dominant for the processing of spatial information (25–27). Lateralization is present at birth in these animals as neonatal tail posture asymmetries predict adult pattern of spatial preference (28–30). Numerous other examples of behavioral lateralization in animals have been documented (see 25 for review).
Anatomical asymmetries also occur non-human animals. The left
Sylvian fissure of chimpanzees is longer on the left in 80% of
the animals, with 12% having no asymmetry and 8% exhibiting the
reversed asymmetry (31),
a pattern similar to that seen in humans (12, 31–33). LeMay found a longer Sylvian
fissure length on the left in great apes, but not in the lesser
apes and monkeys (34)
In baboon brains, the right frontal pole was longer in 6 of 7
brains, with the seventh brain having poles of equal length (35). These
are similar to the findings in humans, in whom the right frontal
pole protrudes farther (36).
In addition to the finding in primates, anatomic asymmetries have been found in species ranging from reptiles (37) to amphibians (38–41) to birds (42) to rodents. In male rats, for example, the right neocortex is thicker than the left (43), wider, and taller (44). Female rats, on the other hand, have slightly thicker left neocortices—an asymmetry that can be reversed to the male pattern by neonatal ovariectomy (45). Others have found that prenatal stress reversed the patterns of asymmetry in male rats, making them more like the females (46, 47).
Although anatomic cerebral asymmetry appears in all animals that have been examined, its link to functional lateralization is not clear. Most workers, for example, find that approximately two-thirds of all human brains have a leftward anatomic asymmetry in language-related regions. This is contrast to the generally accepted figure that over 90% of individuals have language lateralized to the left hemisphere. It could be that this discrepancy is due to the measurement of functional lateralization—most available methods could underestimate the frequency of bilateral representation. Another contributor to this imperfect relationship between structure and function may be that at least in some brains bigger is not necessarily better. It could also be that there are fundamental differences in the cellular, histologic, morphologic, or ontogenetic history between anatomically symmetric and asymmetric brains that may be more important to function than relative brain size.
In the hopes of better understanding the processes that distinguish symmetric and asymmetric brains, we have conducted research on human and rat brains. Rats exhibit the full range of asymmetry in the visual and somatosensory cortices, as well as other areas. The main difference between rat (and for that matter all mammals studied) and human brain asymmetry lies in distinction between population and individual asymmetry. Humans are by and large individually asymmetric, that is most brain regions show left-right asymmetry, and are also asymmetric at the population level—the majority of individuals have anatomic asymmetries in the same direction. In contrast, the rat exhibits individual asymmetry but population level asymmetries, when present, are not nearly as impressive. Indeed, Collins has demonstrated in the mouse that one can breed selectively for magnitude of asymmetry but not direction (48). This distinction between the magnitude of asymmetry (i.e., individual) and direction of asymmetry (i.e., population) is important to keep in mind in the discussions that follow.
We hypothesize that asymmetric regions function differently than their symmetric counterparts because of fundamental differences in the cellular, connectional, and probably also subcellular and molecular make-up. To examine this, we specifically addressed the following questions:
1) What gross morphometric
characteristics differentiate symmetric and asymmetric brain
regions?
2) What are the contributions of cell number
and cell packing density to the formation of symmetric and asymmetric
regions?
3) How do symmetric and asymmetric brain
regions develop?
4) Do symmetric and asymmetric brain regions
have different patterns of callosal connectivity?
CHARACTERISTICS OF GROSS ANATOMIC ASYMMETRY
The comparison of morphometric characteristics of symmetric and asymmetric brain regions is schematized in Figure 1. With respect to asymmetric brain regions, symmetry can result developmentally from either an increase in the normally smaller side, a decrease in the usually larger side, or a combination of the two processes. In the first case, the measure of total brain area of symmetric brain regions would be larger than their asymmetric counterparts whereas the opposite would be true in the second case. Brain areas would be similar if the third scenario were true.
 |
Figure 1.Schematic illustrating the three hypothetical possibilities when comparing an asymmetric to symmetric brain regions. With respect to the asymmetric brain (top row), symmetric brain regions (middle row) can result from two small sides (left), two large sides (right), or with one side smaller and the other larger (middle). Each of these possibilities carries with them predictable outcomes based on the comparison of the total (right + left) area (or volume) of a region to the asymmetry coefficient (bottom row). Thus, when the symmetric brain region results from two small sides, a positive correlation between these two variables occurs. On the other hand, a negative correlation would be predicted if symmetric brain regions resulted from two large sides. In the case of the symmetric brain region consisting of an increase in one side and a decrease in the other, there would be no change in total volume with changes in asymmetry coefficient. |
To test these hypotheses, we examined the same photographs of the 100 brains used by Geschwind and Levitsky (7) and measured the total planum area in the left and right sides (49). Similar to their findings, we found a leftward asymmetry in 63%, while 21% were rightward asymmetric and 16% had no bias. When we plotted the total planum area (right + left) against a measure of directionless asymmetry, we found a significant negative correlation, indicating that as asymmetry increased, the total planum area decreased (r = -0.530, p < 0.05). Moreover, the area of the smaller of the two plana significantly predicted degree of asymmetry (r = -0.831, p < 0.05), whereas the there was no correlation between the degree of asymmetry and the size of the larger planum (r = 0.065, ns). These results demonstrate that symmetric brains are larger than their asymmetric counterparts and, further, support the hypothesis that asymmetry is the result of the production of a small side rather than the production of a large side.
Cell-packing density and cell numbers are the only two parameters
of cellular arrangement that determine architectonic volume.
Thus, the differences between asymmetric and symmetric brains
(e.g., that symmetric brain regions are larger than those that
are asymmetric) may be explained by: 1) a difference in cell
numbers without any change in cell-packing density, 2) changes
in cell-packing density without differences in cell numbers,
or 3) a combination of changes in cell-packing density in the
number of cells.
We measured the volume of cortical area 17 (the primary visual cortex) of the rat and found a negative correlation between the total volume of area 17 and degree of asymmetry (Figure 2a). Thus, rats with asymmetric brain regions have, like the human, smaller regions than those with symmetric ones. This having been established, we estimated cell packing densities in area 17 of each hemisphere and found that there was no correlation between its asymmetry and asymmetry of architectonic volume (r = 0.115, ns; Figure 2b). On the other hand, we found a highly positive correlation between cell number asymmetry and volume asymmetry (r = 0.906, p < 0.05), indicating that there were greater number of cells in the larger of the two hemispheres (Figure 2c). We concluded, therefore, that architectonic areal asymmetry must be due to changes in total numbers of neurons (50).
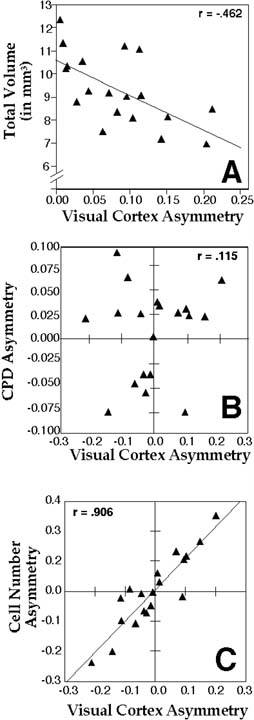 |
Figure 2. Scatterplots showing relationship of (A) directionless asymmetry coefficient and total area of the primary visual cortex, B) asymmetry coefficient the cell packing density asymmetry, and C) asymmetry coefficient the cell number asymmetry. r = Pearson product-moment correlation coefficient (p < 0.05 in panels A and C, not significant in panel B). From (50). Correlation in panel A is different than reported previously (50) because of subsequent changes in the methods of estimation of cytoarchitectonic volume (72). |
That changes in cell numbers rather than cell packing density relate to asymmetry is not surprising because changes in cell-packing density large enough to account for the substantial areal asymmetries would clearly distort the cytoarchitectonic appearance and make recognition of homologous areas impossible. Others have shown that changes between cytoarchitectonic intrahemispheric borders are subject to the same mechanism—specifically, changes in cell numbers and not cell packing density (51).
It could be, however, that while the overall cell-packing density is not predictive of asymmetry, specific neuronal subtypes might be differentially concentrated in symmetric and asymmetric brains. In order to investigate this issue, we counted parvalbumin- or vasoactive intestinal peptide- (VIP) immunoreactive neurons in the somatosensory/somatomotor area (SM-I) of the left and right hemispheres of rats (52). We chose these two neuronal subtypes because of their robust staining in the neocortex, and more importantly because parvalbumin-positive cells correspond to long projection neurons (53) and may co-localize with GABA (54), while VIP immunoreactivity is seen in the cerebral cortex mostly with non-pyramidal neurons (55, 56) and there is no evidence that neurons can be double-labeled for both antibodies.
Replicating our previous findings, we found a significant negative correlation between total volume and volumetric asymmetry of SM-I (r = -0.481, p < 0.05). There was a significant positive correlation between SM-I volume asymmetry and both Parvalbumin (r= 0.831) and VIP (r = 0.551) cell number asymmetry (p < 0.05 in both cases; Figure 3a,b), which indicated that there are greater numbers of each of these types of cells in the larger SM-I. On the other hand, there was no significant correlation between asymmetry of VIP neuronal density and SM-I volume asymmetry (r = 0.030, ns; Figure 3d), but the correlation between parvalbumin neuronal density and asymmetry approached significance (r = 0.410, p = 0.081; Figure 3c). Using a repeated measures ANOVA, we found that there was a greater cell packing density of parvalbumin neurons in the “large side” as opposed to “small side” (x ± SEM = 4935.1 ± 124.2 cells/mm3 vs. 4812.4 ± 138.3 cells/mm3, respectively; F1,18 = 6.68, p < 0.05). There were no such differences in the concentrations of VIP neurons in the “large” and “small” sides (1228.9 ± 65.2 cells/mm3 vs. 1240.6 ± 71.51 cells/mm3, respectively; F1,18 = 0.17, ns).
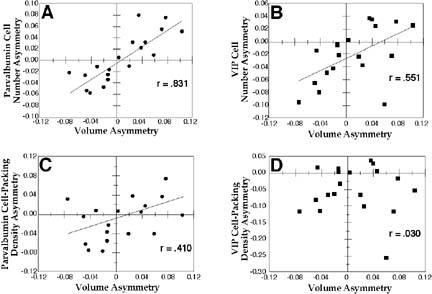 |
Figure 3. Scatterplots showing relationship of asymmetry coefficient of SM-I and A) parvalbumin cell number asymmetry, B) VIP cell number asymmetry, C) parvalbumin cell packing density asymmetry, and D) VIP cell packing density asymmetry. r = Pearson product-moment correlation coefficient (p < 0.05 in panels A and B, p=0.081 in panel C, and not significant in panel D). From (52). |
As described above, we had previously demonstrated that interhemispheric differences in the volume of a cytoarchitectonic area were directly proportional to left-right differences in the number of neurons, rather than cell-packing density (50). We’ve also found that there was a direct relationship between the number of both VIP- and parvalbumin-positive neurons and the volume of neocortical region SM-I—the larger of the two hemispheres had a greater number of both parvalbumin- and VIP-positive cells. This suggests that right-left differences in neocortical volume may underlie interhemispheric differences in the number of both neuronal subtypes. On the other hand, there was a weak, but significant, relationship between cell-packing density of parvalbumin-, but not VIP-positive, cells and neocortical volume. Specifically, there was in increase in the cell-packing density of parvalbumin-positive cells in the larger of the two hemispheres.
Thus, the processing capacity of the larger of two asymmetric homologous areas may be greater because it has more neurons. This is true both for parvalbumin-immunoreactive neurons, which represent mostly long projection neurons, and for VIP-immunoreactive neurons, which represent a class of local circuit neurons. In addition, the increased concentration of parvalbumin-immunoreactive neurons in the large side may produce qualitative differences in connectivity. On the other hand, the decreased cell-packing density of the smaller side may reflect compensation for its smaller number of parvalbumin-positive neurons, which now have larger neuropil. The latter interpretation would indicate that both sides have equivalent functional properties, one by cell numbers the other by cell size. Direct measurement of cell sizes will be needed to help distinguish between these two possibilities.
DEVELOPMENT OF ANATOMIC ASYMMETRY
Because asymmetries in some areas of the human brain are visible shortly after the middle of gestation (57) , it is likely that the production of cerebrocortical asymmetry depends on early developmental factors that determine neuronal numbers in the cerebral cortex. Rakic (58) suggests mechanisms by which neuronal numbers can be ontogenetically regulated. The number of neurons within a cortical area is determined by: (a) the number of early progenitor cell divisions, which affects the number of proliferative neuroblasts in the germinal zone; (b) the number of divisions of neuroblasts occurring after the birth of the first neuron (i.e., proliferation); and (c) ontogenetic neuronal death, which can occur either early (in the germinal zone) or late (after the birth of the first neuron). Using these guides, volume asymmetry of cytoarchitectonic areas could be the result of side differences (1) occurring in the germinal zone, (2) in proliferation. or (3) in cell loss, either in the germinal zone or later in ontogenesis. The implications of these hypotheses are summarized in Figure 4.
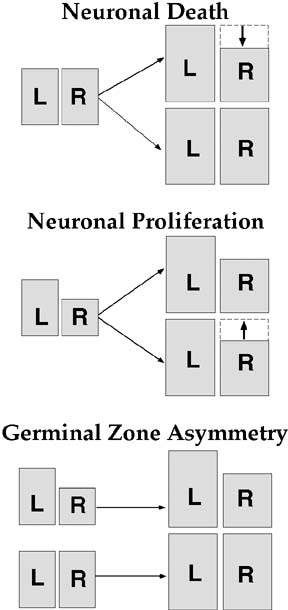 |
Figure 4. Schematic illustrating three scenarios for the ontogeny of cerebral asymmetry. All scenarios are constrained by the finding that symmetric brains regions are larger overall than asymmetric brain regions. If neuronal death plays a role in the formation asymmetry, then brain regions must be symmetric in the germinal zone. Symmetric brains arise from proliferation of symmetric germinal zones. Asymmetric brain regions would result from neuronal death, making one side smaller than the other. Alternatively, if neuronal proliferation were the underlying mechanism, then brain regions must be asymmetric in the germinal zone. Symmetric brain regions would be due to differences in cell proliferation in one side, causing the smaller side to increase in size during development. Finally, if neither proliferation nor cell death played a role in the ontogenesis of asymmetry, then symmetric and asymmetric brain regions would arise from symmetric and asymmetric proliferative units in the germinal zone. From (62). |
We attempted to determine the contribution of proliferation to the production of asymmetry of neuronal numbers in asymmetric architectonic areas by labeling with [3H]thymidine neurons undergoing their last mitosis. After neuronal migration and postmigrational ontogenetic neuronal death, the number of heavily labeled neurons present in a cortical area would reflect those neurons that were born at the time of injection minus those that died or were otherwise lost to neighboring architectonic areas by tangential movement (59, 60) or fluctuations in boundary placement (58). We reasoned that changes in the ratio of labeled to unlabeled neurons (labeling ratio) between architectonic regions would reflect differences in production of neurons during the late phase of corticogenesis, while postmigrational neuronal loss of neurons would have no effect on this measure, since both labeled and unlabeled cells would be equally affected. Furthermore, early proliferative cell division, which takes place before the injection of thymidine would likewise have no effect on this ratio. Therefore, assuming appropriate sampling over the course of neurogenesis, any differences in the labeling ratio between two cortical areas, including homologous hemispheric areas, must reflect differences in late neuroblast division.
If the lengths of the cell cycles differ in two cortical areas after pulse injections of thymidine, then a substantial difference in neuronal production could occur without changing the labeling ratio. A shorter cycle can lead to more cells being produced by a radial unit over time, which, if it does not grow in radial length, must result in increased cell-packing density. We assessed potential cell cycle differences by estimating and comparing cell-packing densities and the numbers of labeled neurons between two sides of symmetric and asymmetric cases.
We injected pregnant rats with [3H]thymidine on either embryonic day (E) E15, E17, and E19 and their pups were sacrificed on postnatal day (P) P10, P30, or P60. The neocortical architectonic boundaries of primary visual area 17 and visual association area 18a were determined, their volumes computed in both the right and left hemispheres, and the numbers of labeled and unlabeled neurons were counted within these cytoarchitectonic areas.
There were never hemispheric differences in labeling ratios between left and right sides, regardless of degree of asymmetry. Thus, we did not find that later neuroblast division plays a significant role in the production of asymmetry. There were, however, differences in the labeling ratios of architectonic areas 17 and 18a, thus demonstrating that architectonic specification can be explained, at least in part, by areal differences in late neuronal production. This finding has since been replicated in monkeys (61).
There was no difference in cell cycles between the hemispheres in areas 18a or 17, as assessed by labeled cell-packing density and radial extent. On the other hand, we found no significant differences in labeled cell packing densities between area 17 and area 18a. Thus, cell cycle length appears not to differ between homologous areas, asymmetric or not, but differs between non-homologous cytoarchitectonic areas.
In summary, our data support the notion that events occurring early in corticogenesis—specifically during the period of progenitor cell proliferation and/or death (before the birth of the first neuron)—are important for the formation of asymmetric cortical areas such that division and death of progenitor cells change the number of neuroblasts on the two sides. We found no evidence that late neuronal production contributes to asymmetry. Given the lack of cell-packing density differences between the sides, it is unlikely that postmigrational neuronal death plays a significant role. However, our experiments do not definitively exclude a modest contribution of asymmetric neuronal death which might enhance the already present asymmetry of cell number (62).
CALLOSAL CONNECTIONS AND ASYMMETRY
It has long been speculated that the mechanism for cerebral dominance might lie in the callosal connectivity-that the dominant hemisphere exerts control over its homologue through the corpus callosum (63). By this reasoning, one might expect that the larger, dominant brain region, which has more cells than its homologue, sends more (and different?) projections across the corpus callosum. Alternatively, it could be the case that symmetric and asymmetric brains differ in the number and pattern of connections.
We sought to investigate the latter question by severing the corpus callosum of the rat and looking at the pattern of axonal terminal degeneration with reference to asymmetry in the callosally related areas (64). Specifically, we parceled SM-I and determined the percent of callosal terminal degeneration (callosal ratio). As previously reported for other brain regions (see above), we again found a negative correlation between the degree of asymmetry and total (right+left) volume of SM-I (r = -0.780, P < 0.05) indicating that as the degree of asymmetry of the architectonic region increased, the total volume of the region decreased. In addition, there was a significant inverse relationship between asymmetry coefficient and callosal ratio (r = -0.889, P < 0.05). This indicated that in symmetric regions a greater percentage of SMI received callosal terminations than in asymmetric regions.
Because callosal projections in the rat segregate into patches of termination, these results—that symmetric brains have a greater callosal ratio than do asymmetric brains—suggest a number of possible interpretations as illustrated in Figure 5. It could be that there are more patches of termination in symmetric brain regions as compared to asymmetric. Alternatively, if there were similar numbers of patches of degeneration in symmetric and asymmetric regions, the width of these patches would be greater in the symmetric cases. A third possibility is that there are more patches of callosal termination in asymmetric brains but that these patches symmetric regions occupy a greater proportion of the region.
 |
| Figure 5. Figure illustrating three possible outcomes based on the finding of an inverse relationship between volume asymmetry and callosal ratio. Asymmetric brains (top row) could have more patches of termination than symmetric brains (middle row, left); this would produce a positive correlation between number of patches and asymmetry coefficient (bottom row, left). Asymmetric brains could have the same number of patches of termination as symmetric brains (middle row, center), but they would be wider in the latter; in this case there would be no correlation between numbers of patches and asymmetry coefficient (bottom row, center). Finally, there could be more patches of termination in the symmetric brain (middle row, right), but they would occupy a greater proportion of the region. In this case, a negative correlation would be found between the asymmetry coefficient and number of patches of termination (bottom row, right). From (64). |
In order distinguish among these possibilities, we counted the number of patches of callosal termination and found a negative relationship between them and the asymmetry coefficient indicating that there are more patches of callosal termination in the symmetric, as opposed to asymmetric, brain regions (r = -0.857, P < 0.05). It would appear then, that more symmetric brains have relatively greater numbers of callosal fibers and that there are more patches of termination in symmetric brains.
If the detailed architecture of connections, as well as their number, affects functional capacity, symmetric and asymmetric brains may differ in their preferred cognitive strategies as well as in their extent of hemispheric lateralization. For example, researchers have demonstrated a difference in the midsagittal area of the corpus callosum between left and right handers whereby left handers, whose brains may be more likely to be symmetric (17, 65), had larger midsagittal corpus callosum areas (the result of more and/or thicker fibers) than did their right-handed counterparts (66–68). It is possible that the greater cross-sectional area of the corpus callosum in left handers reflects cerebral symmetry.
Because asymmetric areas have fewer neurons than symmetric areas, and since some of these neurons may be callosally connected, it is reasonable to suggest that asymmetric areas could have fewer callosal connections (69). But, according to this reasoning, it is not expected that the callosal ratio would differ, since both neurons and axons would be proportionately reduced. Instead, callosal axons diminish out of proportion to cell numbers and this relative deficit of callosal connections must mean that with increasing asymmetry, some neurons withdraw their callosal axons during development while they maintain intrahemispheric connections. Supporting this notion is the finding, described above, that the density of long connecting parvalbumin-immunoreactive cells is decreased in the smaller of the two sides in asymmetric cases (52). Alternatively, there could be a disproportionate loss of callosally related, as compared to noncallosal cells in the asymmetric case. On the other hand, others have shown that neuronal death is not a major factor in the development of callosal projections in SM-I (70, 71). The resolution of these findings awaits further research.
CONCLUSIONS
We have found that as asymmetry increases, the total area of the region decreases, suggesting that when a brain is symmetric, it is the result of two large sides rather than two small sides. Also, these volume differences are caused by changes in the overall number of cells, not changes in cell-packing density, although there are differences in cell packing density in certain neuronal subtypes. The ontogenetic basis for this difference in cell numbers likely relates to events that occur quite early in corticogenesis before final mitosis of proliferative units, but definitive proof is lacking. Finally, the pattern and degree of callosal connections differ between symmetric and asymmetric brains, with differential axonal pruning being implicated as the likely mechanism.
The relationship of anatomic asymmetry to functional lateralization is still far from being understood. What is clear, however, is that simple phrenological notions of the relationship between functional lateralization and anatomic asymmetry do not explain the variety of differences we’ve demonstrated. It may therefore prove to be more useful in the future to concentrate on the biologic differences between those brain regions that are asymmetric and those that are symmetric. The hope is that better descriptions of these differences at the morphologic, cellular, connectional, ontogenetic, and molecular levels may lead to increased understanding of hemispheric specialization.
ACKNOWLEDGMENTS
This work was performed collaboratively primarily with Drs. Albert M. Galaburda and Gordon F. Sherman, and the author thanks them for all their input. Other collaborators included Drs. Francisco Aboitiz, Joan Corsiglia, and Kari Emsbo. The author also thanks Drs. Patricia Cowell and R. Holly Fitch for their helpful input in preparing this manuscript. This work was supported, in part, by grants NS27119 and HD20806.