Note to the Reader This is a preprint of a paper now in press at the Journal of Neuroscience (Spring 2001). Please cite this work as: Lu L, Airey DC, Williams RW (2001) Complex trait analysis of the hippocampus: Mapping and biometric analysis of two novel gene loci with specific effects on hippocampal structure in mice. J Neurosci 21:3503-3514. The definitive print and html versions are available on the Journal of Neuroscience web site.
Contents Introduction ABSTRACT Notable differences in hippocampal structure are associated with
intriguing differences in development and behavioral capabilities. In this
study we explore genetic and environmental factors that modulate
hippocampal size, structure, and cell number using sets of C57BL/6J (B6)
and DBA/2J (D2) mice; their F1 and F2 intercrosses (n = 180); and 35 lines
of BXD recombinant inbred (RI) strains. Hippocampal weights of the
parental strains differ by approximately 20%. Estimates of granule cell
number also differs by 20%. Weights of RI strains range from 21 to 31 mg;
those of F2 mice from 23 to 36 mg (bilateral weights). Volumes and granule
cell numbers are well correlated (r = 0.7–0.8). An important component of
the structural variation is associated with age and sex differences. The
hippocampus gains weight with age (~0.24 mg/month from 2 to 10 months),
and hippocampi of males typically weigh 0.55 mg more than those of
females.
Structural variation in hippocampus can be substantial. Among normal
humans hippocampal volume varies roughly two-fold—from 6 to 11 cm3
(Csernansky et al., 1998; De Bellis et al., 2000). Classic biometric
studies by Richard and Cynthia Wimer and their colleagues demonstrated
that pervasive differences in hippocampal structure among inbred strains
of mice are due to a complex mixture of genetic, environmental, and
maternal effects (Wimer and Wimer, 1971; Barber et al., 1974; Wimer et
al., 1976; Wimer et al., 1978; Wimer and Wimer, 1982). This well
characterized variation in mice is now especially intriguing for two
reasons. First, the discovery, characterization, and manipulation of
neuronal and glial stem cells in rodent forebrain (Altman and Das, 1965;
Bayer et al.,1982; Kaplan and Bell, 1984; Stanfield and Trice, 1988;
Cameron et al., 1993; Gould, 1994) has invigorated research directed at
isolating factors that modulate rates of stem cell cycling and
proliferation (Palmer et al., 1997; Kuhn et al., 1997; Kempermann et al.,
1997ab, 1998). Gage and colleagues have shown marked differences in the
dynamics of cell proliferation in the dentate gyrus among inbred strains,
including the two key strains, C57BL/6 and DBA/2, that we have used in the
present study (Kempermann et al., 1998; Kempermann, personal
communication). Two complementary groups of mice were used in this study. The first
consisted of a set of 35 BXD/Ty recombinant inbred (RI) strains. All of
these strains were used both for gene mapping and for the biometric
analysis of the hippocampus and its parts. The BXD RI strains were
generated by crossing C57BL/6J (B6) and DBA/2J (D2) parental strains in
the mid-1970s (BXD1 through 32) and 1990s (BXD33 through 42) by Benjamin
Taylor and colleagues (1989, 1999). RI strains are completely inbred lines
derived from brother-sister matings starting from an F2 intercross. They
are advantageous for complex trait analysis for several reasons explained
in Williams (1998, 2000). First, numerous individuals with identical
genomes can be phenotyped and this greatly improves the precision with
which phenotypes such as hippocampal weight can be measured. The key
parameter used during QTL mapping becomes a strain mean rather than an
individual value. We typically averaged values from eight animals for
weight data and five animals for volumetric data (both sides were analyzed
in both cases), with the goal of reducing standard error of the mean to
well under 1 mg. In fact, the coefficient of error (SE/mean) averages only
1.8% whereas the coefficient of variation (SD/mean) averages 3.7% (Table
1). A related advantage of RI strains is that they can be shared among
many investigators over a period of many years. The large strain
differences in hippocampal structure and cell density that we report can
now be followed up by developmental, physiological, pharmacological, and
behavioral studies. From the point of view of gene mapping, one drawback
of RI strains is that only a limited number of strains are available for
analysis, a factor that decreases the power to detect QTLs with small
effects. For this reason we have supported our RI work with a matched
analysis of an F2 intercross. Animal husbandry and age Mice were maintained at 20–24 °C on a 14/10h light-dark cycle in a
pathogen-free colony at the University of Tennessee. Most animals were fed
a 5% fat Agway Prolab 3000 rat and mouse chow and given tap water in glass
bottles. The average age of BXD/Ty animals was 80 days; that of F2 mice
was 98 days (F2
data in text format for cases). Parental strains and the set of BXD/Ty
strains were obtained from the Jackson Laboratory (Bar Harbor, Maine) from
1994 through 1999. Fixation Mice were deeply anesthetized with Avertin (1.25% 2,2,2-tribromoethanol
and 0.8% tert-pentyl alcohol in water, 0.5–1.0 ml ip). Most mice were
perfused through the heart with 0.1 M phosphate buffered saline followed
by 5% glutaraldehyde and 1.0% paraformaldehyde in 0.1 M phosphate buffer,
and then by 2.5% glutaraldehyde and 2.0% paraformaldehyde in 0.1 M buffer. Dissection Fixed brains were bisected along the midline (Fig. 1). Left and right
hippocampal regions were dissected under a dissecting microscope by
inserting fine blunt forceps into the ventricular cavity just dorsal to
the hippocampus and removing overlying cortex and callosum. The surface of
the hippocampus and dentate gyrus was used to guide removal of cortex
along the septotemporal axis. The exposed hippocampus and dentate gyrus
was pulled free of the hemisphere in a ventral-to-dorsal direction. The
dissection includes a small part of the subiculum adjacent to CA1 and
occasionally a small strand of the fimbria. As shown in the Results,
technical error and inconsistency was very low as judged by right left
differences witiin cases. The most dorsal-anterior aspect of each
hippocampus was then trimmed free of septum and dorsal fornix, rolled
quickly in tissue paper, and immediately weighed to the nearest 0.1 mg.
The first author made all dissections. The following data were obtained
for virtually all cases: sex, age at death, body weight, brain weight,
cerebellar weight, and left and right hippocampal weights. Original data
files are available at
www.nervenet.org/databases/hippocampus.html.
Complex trait analysis of the hippocampus:
Mapping and biometric analysis of two novel gene loci with specific
effects on hippocampal structure in mice
Lu Lu, David C. Airey, Robert W. Williams
Center for Neuroscience and Department of Anatomy and Neurobiology,
University of Tennessee, 855 Monroe Avenue, Memphis, Tennessee 38163 USA
Email questions and comments to lulu@nb.utmem.edu
Methods
Volumetric Analysis
Stereology
Regression Analysis
Genotyping
Results
Table
1: Hippocampal Weight Data
Table
2: Correlation Matrix
Figure 2: Regression Plots
Figure 3: Relations among Subregions
Figure 4: Interval Maps
Primary Data Files
BXD
strain data in Map Manager text format: New data set
BXD
data for individual mice: Sex, age, weight, etc.
F2
genotype and phenotype data in Map Manager text format
F2
data for individual mice: Sex, age, weight, etc.
Discussion
Structure and Function
Behavioral QTLs and Hipp1
Specificity of QTL Action
Candidate Genes
Sex Difference
Adult Neurogenesis and Hippocampal QTLs
References
Heritability of variation is ~50% and half of this genetic variation
is generated by two quantitative trait loci (QTLs) that we have mapped to
chromosome 1 (Hipp1: genome-wide p < 0.005, between 65 and 100 cM) and to
chromosome 5 (Hipp2, p < 0.05, between 15 and 40 cM). These are the first
gene loci known to produce normal variation in forebrain structure in
mammals. Hipp1 and Hipp2 individually modulate hippocampal weight by 1.0
to 2.0 mg, an effect size greater than that generated by age or sex. The
Hipp gene loci modulate neuron number in the dentate gyrus, collectively
shifting the population up or down by as much as 200,000 cells. Candidate
genes for these loci include Rxrg and Fgfr3. 
Our thanks to Dr. Baoyan Hu for this translation.
Introduction
The second complementary reason to be interested in strain
differences is that recent advances in quantitative and molecular genetics
make it practical to map, characterize, and clone gene loci that influence
a wide range of heritable neuroanatomical and behavioral traits (Williams,
1998; Rikke and Johnson, 1998; Williams,
2000). This forward genetic approach initially involves associating
differences in alleles at defined chromosomal positions with differences
in a trait—in our case the size, architecture, and cellular composition of
the mouse hippocampus. A strong association between phenotypes and
genotypes indicates the presence and position of a quantitative trait
locus, or QTL (Darvasi, 1998; Williams 2000). Complex trait analysis has
proved to be highly effective for neuroanatomical and behavioral traits.
For example, by taking advantage of differences between several strains of
mice, we recently succeeded in mapping a set of gene loci that
specifically modulate numbers of neurons in the mouse retina (Williams et
al.,
1998; Strom and Williams,
1998;
Strom
1999). The deluge of sequence data, combined with greatly improved QTL
mapping strategies, promises to revolutionize the quantitative genetic
analysis of CNS development (Darvasi, 1998; for progress on mouse
sequencing efforts see,
www.ncbi.nlm.nih.gov/genome/seq/MmProgress.shtml). In the case of the
hippocampus, it is now possible to use QTL methods to highlight a crucial
subset of genes and alleles that modulate hippocampal structure and
function at all stages of life.
In this study we use biometric and genetic techniques to explore the
basis of variation in the size and structure of the hippocampus. Our work
begins with a systematic multiple linear regression analysis of the
effects of age, sex, body and brain weight on the adult hippocampus. This
work is of interest in its own right, but in the context of gene mapping
studies is a prelude to interval mapping. We have succeeded in identifying
and verifying two gene loci that control the size of the hippocampus.
These two loci are among the first genes associated with normal variation
in forebrain anatomy in any vertebrate. We have examined the
cytoarchitecture of the hippocampus and granule cell density in the
dentate gyrus to assess the scope of action of these novel gene loci. Material and Methods
The second group of mice that we used consisted of reciprocal F1 and
F2 intercrosses between B6 and D2, the same strains used to make the BXD
RI strains. Thus these two groups share precisely the same sets of parents
and parental alleles. The F2 animals were generated at the University of
Tennessee by intercrossing both BDF1 and DBF1 mice as described in Zhou
and Williams (1999);
105 of the animals were BDF2s and 75 of the animals were DBF2s. An F2
intercross is often used to complement the analysis of recombinant inbred
strains, and in this study we have used the F2 to confirm and refine the
location of QTLs that modulate hippocampal weight. An F2 intercross has
the advantage over the RI set of a much larger number of genomes to
correlate with phenotypes. The disadvantage to this cross is the effort
required to genotype each individual mouse. In our study 180 animals were
genotyped at 128 microsatellite marker loci as describe below.
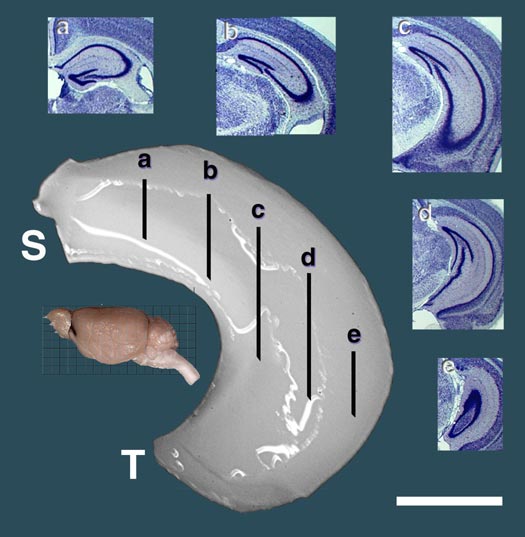
Figure 1. An example of the dissected hippocampi used to generate the weight data for mapping Hipp1 and Hipp2. This dissection is from the left hemisphere and is oriented properly with respect to the septotemporal (S and T) axis of the inset mouse brain. The internal anatomy of the hippocampus is referenced by five insets showing coronal Nissl stained sections (a-e). Scale bar is 1 mm. [Click on figure for a larger version.]
Volumetric measurement of the hippocampus
A second independent set of 31 BXD strains and the two parental strains that are part of the Mouse Brain Library (www.mbl.org) was studied to assess specificity of QTL action, and to determine if QTLs affecting hippocampal size have regional effects limited to the dentate gyrus, the hippocampus proper, the pyramidal cell layer, or the granular cell layer. Images of the serial sections through the entire hippocampus from 154 BXD cases (average of 5 per strain), 8 C57BL/6J cases, and 6 DBA/2J cases were downloaded from www.mbl.org and analyzed in NIH Image. Images were not available for four BXD strains 6, 16, 21, 37. Serial section images have a resolution of 4.5 µrs of the hippocampus, excluding the subiculum, but including the fimbria and dentate gyrus (see Figure 1, a-e) were traced manually. The dentate gyrus was traced separately. The area of the set of sections was multiplied by the section interval to estimate volume. Finally, areas of the pyramidal cell layer (CA1–CA3) and the granule cell layer were measured bilaterally for all cases. These layers have a high cell packing density and can be reliably defined by a thresholding operation in NIH Image. To improve uniformity of the data set the first author conducted all thresholding. The reliability of thresholding was tested by repeated measures analysis. The correlation of duplicated estimates is 0.95. Shrinkage among cases in the Mouse Brain Library is variable, but known. To correct for variance due to shrinkage, we divided hippocampal volumes by the total brain volume and then multiplied by the brain volume expected from the known brain weight, assuming a brain density of one mg per mm3 of fixed tissue. The post-processing volume of the total brain was measured by point counting as described in Williams (2000). All volume data have been corrected for shrinkage, case-by-case. The correlation between weight and volume from two different sets of BXD animals is 0.61 (df = 31, p < 0.01). Volumetric data used in the results are group means based on 4 to 6 cases per stain.
Stereological analysis of cell density in the dentate gyrus of BXD strains
Mean cell density in the dentate gyrus was determined bilaterally in an
average of five cases of each of 33 BXD strains. For this work we used
tissue from the Mouse Brain Library described in the preceding paragraph.
All tissue was embedded in celloidin and cut at 30 µm in coronal or
horizontal planes by G.D. Rosen and colleagues. Precise volumetric
shrinkage for each case had been previously computed as described at
www.mbl.org and this has made it possible to compute the expected density
for fixed brain tissue prior to processing (Table
1; see web movie at
www.nervenet.org/mbl/movies/Z-hilus.html). Granule cells, glial cells,
and endothelial cells were counted separately using the 3D counting
procedure of Williams and Rakic (1988).
Glial cells and endothelial cells make up only a very small fraction of
the total cell count (<10%) and were relatively easy to distinguish. The
volume of the count box was fixed at 17 x
18 x
30 µm and did not include an upper guard space. The z-axis was monitored
using a calibrated rotary shaft encoder as described in Williams and Rakic
(1988).
This modification of the 3D-counting protocol avoids potential bias
introduced by differential z-axis shrinkage (Hatton and von Bartheld,
1999; von Bartheld 1999). The sample volume was counted using a
contrast-enhanced video differential interference contrast system and a
1.25 NA 100x
planachromat objective. Final magnification on the monitor was 4000x.
All cell density estimates are corrected case-by-case for volumetric
shrinkage.
We computed the mean neuron cell packing density in the granule cell
layer at a consistent location 2.0 to 2.3 mm posterior to bregma, at a
level that corresponds to the central part of the dorsal lateral
geniculate nucleus (Fig.
1B). The counting boxes were located in the dorsomedial apex. For each
RI strain the mean cell density estimate is based on ten counts from five
individuals. These density estimates have a very low coefficients of error
(3% or 60,000 cells/mm3) across cases within
strains. Given this single point sampling protocol, it was of interest to
assess how representative values obtained at minus 2.0 AP are of the
entire dentate gyrus. For a subset of five cases (three C57BL/6J and two
DBA/2J cases) we explored this question by carrying out high density
sampling of sections spaced at 300 µm intervals in coronal and horizontal
planes. An average of 70 fields were counted using a systematic random
protocol (Howard and Reed, 1998). Cell densities tend to be higher in the
rostral and dorsal regions than in the caudal temporal region. The
difference between extreme poles is approximately 40%. The gradient of
cell density across the granule cell layer is more modest. The marginal
part the granule cell layer (both molecular and hilar sides) has a density
that is approximately 10–20% lower than that of the most central part the
granule cell layer. The sampling sites that we selected for analysis is
intermediate in both position and in mean cell density and yield good
estimates of total granule cell number. For example, comprehensive
estimates of granule cell number from three C57BL/6J mice obtained using a
dense sampling grid (60 to 80 samples per side) are 484,000 ± 16,000,
465,000 ± 16,000, and 435,000 ± 16,000. This gives a unilateral average of
443,000 granule cells. In comparison, the estimate given in
Table 1 that is based on counts from 5 cases and 10 bilateral samples
taken at AP –2 is 443,000 with a standard error of about 15,000 (note that
the estimates in Table 1 are given for the sum of both sides and for
comparison were divided by two). Our estimate for this strain is close to
that recently obtained by Abusaad and colleagues (493,000 based on six
9-week-old cases also of both sexes). Similarly, estimates for the two
comprehensive estimates of the other parent, DBA/2J, were 360,000 ± 11,000
and 312,000 ± 8,000. This compares to a mean of 349,000 cells in Table 1.
The agreement is satisfactory and estimates listed in Table
1 are of sufficient accuracy to gauge effects of the two Hipp loci on
dentate granule cell populations.
Regression analysis
Complex trait analysis tests the strength of the relationships between genotypes and phenotypes. The advantages and restrictions of this biometric approach have been reviewed extensively (Tanksley, 1993; Lander and Schork, 1994; Lynch and Walsh, 1998). One issue that is important in our analysis of the hippocampus is the specificity of gene effects. We did not want to inadvertently map genes that control body or brain weight. For this reason we have carried out linear regression analysis to explore and statistically control for covariance between hippocampal weight and other variables using standard techniques explained more fully elsewhere (Sokal and Rohlf, 1995; Williams, 2000). For example, strain BXD5 has an unusually large brain (544 mg), and not surprisingly has an unusually large hippocampus (30 mg). However, after normalizing for brain weight with regression, a process that involves computing residual weight measure, the hippocampus of this strain is not at all exceptional. Computing residuals is preferable to the use of ratios to correct for size differences (Lynch and Walsh, 1998; Bishop and Wahlsten,1999). Controlled parameters in our multiple linear regression analysis include brain weight, sex, age, and body weight. Interactions and second-order terms were not significant. The standard assumptions required from regression analysis were met. Statistics and statistical tests were computed using Data Desk (Data Description Inc, www.datadesk.com).
Genotyping and QTL mapping
In essence, the QTL mapping involves categorizing cases (genetic
individuals) based on their genotypes (e.g., BB, BD, or DD) at defined
chromosomal markers (e.g., microsatellite loci) and comparing these groups
with a quantitative variable; in our case hippocampal measurements (Table
1). A gene locus that affects the hippocampus will be recognized when the
variation in phenotype matches the variation in genotype (see
www.nervenet.org/papers/brainrev99.html for several examples). QTL
mapping generally proceeds from analysis at defined loci (single marker
analysis), to an analysis at positions inferred between loci (simple
interval mapping), and then finally to positions inferred between loci but
with statistical control for background loci of interest (composite
interval mapping). Map Manager implements both simple and composite
interval mapping methods described by Haley and Knott (1992), and
evaluates genotype-phenotype associations with likelihood statistics and
permutation tests. Genome-wide significance levels for assessing the
confidence of the linkage statistics is estimated by comparing the peak
likelihood ratio statistic (LRS) of correctly ordered data sets with LRSs
computed for 10,000 permutations (Churchill and Doerge, 1994). Permutation
tests are a commonly accepted method for determining the probability of
the effect occurring by chance. LRS scores can be converted to logarithm
of odds ratios (LOD scores) by dividing by 4.6.
Genomic DNA from all F2 mice was extracted from their spleens using a
high-salt procedure (Laird et al., 1991; see
PCR
details ). A set of 128 microsatellite loci distributed across all
autosomes and the X chromosome were typed in the F2 progeny using a
modified version of the protocol of Love et al. (1990) and Dietrich and
colleagues (1992). Each 10 m l PCR reaction
contained 1X
PCR buffer, 1.92 mM MgCl2, 0.25 units of Taq
DNA polymerase, 0.2 mM of each deoxynucleotide, 132 nM of the primers, and
50 ng of genomic DNA. The microsatellite primer pairs were purchased from
Research Genetics (Huntsville, AL,
www.resgen.com). A
loading dye (60% sucrose, 1.0 mM cresol red) was added to the reaction
before the PCR (Routman et al., 1994). PCRs were carried out in 96-well
microtiter plates. We used a high-stringency touchdown protocol in which
the annealing temperature was lowered progressively from 60 °C to 50 °C in
2 °C steps over the first 6 cycles (Don et al., 1991). After 30 cycles,
PCR products were run on 2.5% Metaphor agarose gels (FMC Inc., Rockland
ME), stained with ethidium bromide, and photographed. Genotypes were
entered into Microsoft Excel 98 and transferred to Map Manager
QT and
QTX for mapping and permutation analysis. A nonredundant set of loci
typed for all 35 BXD/Ty strains was used for analysis (Williams et al.,
1998; Zhou and Williams, 1999). Approximately 200 genotypes were taken
from Taylor et al., (1999), and an additional 630 new genotypes were
generated for this analysis in our laboratory using the same methods
described above for the F2. The new genotypes are available from the
Informatics Center for Mouse Neurogenetics (www.nervenet.org/MMfiles/MMlist.html).
Map Manager implements both simple and composite interval mapping methods
described by Haley and Knott (1992). Genome-wide significance levels for
assessing the confidence of the linkage statistics was estimated by
comparing the peak likelihood ratio statistic (LRS) of correctly ordered
data sets with LRSs computed for 10,000 permutations (Churchill and Doerge,
1994). LRS scores can be converted to LOD scores simply by dividing by
4.6.
Results
The results are divided into two major sections. The first is a biometric analysis of normal variation in the structure and size of the hippocampus as a function of sex, age, brain weight, and body weight. We initially focus on hippocampal weight data collected for a large number of cases, including all BXD strains (Table 1), 180 F2 progeny, two parental strains, and the reciprocal F1 hybrids. The analysis of weight data is followed by an analysis of absolute and relative volumes of four parts of the hippocampus and a stereological analysis of granule cells in the dentate gyrus of BXD strains. The second section summarizes QTL mapping results and the effects of two gene loci on hippocampal weight, structure, and granule cell number. The analysis of effect specificity of QTLs relies on the BXD strains because a number of individuals of a defined genotype could be examined to ensure accurate trait means. The multiple regression analysis ensures that the QTLs that we have mapped have comparatively selective (although not exclusive) effects on size, structure, and cell populations of the hippocampus.
Normal Variation in Size, Structure, and Cell Number
Hippocampal weights of parental strains
Hippocampal weights of the parental strains B6 and D2 are 28.4 ± 0.7 and 23.0 ± 0.3, respectively (Table 1). This 19% difference is highly significant (t(20) = 17.0, p < 0.001) and corresponds to a 20% difference in number of granule cells in the dentate gyrus of these two strains (Table 1). Total brain weight of B6 is also approximately 20% greater than that of D2 (496 ± 6 mg versus 415 ± 4 mg) whereas body weight is approximately 28% greater at 75 days (24.7 versus 19.3 gm). If hippocampal weights of these strains are adjusted to account for differences in brain and body weight, then the strain difference is reduced to 1 mg: 27.4 ± 0.3 versus 26.4 ± 0.3 (Table 1, column 3). This difference is still statistically significant (t(24) = 17.0, p = 0.04). The hippocampal weight of the reciprocal F1 hybrids—BDF1 and DBF1—are 27.8 ± 0.3 and 28.2 ± 0.4 mg, respectively, an insignificant difference from each other or from the B6 parent.
Table 1. Strain Variation in Hippocampal Structure
Brain weight and hippocampal weight
Variation in brain weight is the single most important predictor of variation in hippocampal weight (r = 0.73, Table 2, Fig 2A), and 50% of the variance in hippocampal size among individual BXD mice can be accounted for by the regression equation: hippocampal weight = 4.08 + 0.05(brain weight in mg). Brain weight includes the hippocampus and to compare fully independent variables we recomputed the relationship after subtracting the hippocampus. Although the slope is almost precisely the same, the amount of variance explained by the equation is reduced by 5.0% (Fig. 2B, Table 2). Among the F2 sample, variation in brain weight is also the most important predictor of variation in hippocampal weight: 57% of variance in hippocampal weight is accounted for by brain weight, whereas 51% is accounted for by brain minus hippocampus.
Figure 2A and 2B. Brain weight effects on hippocampal weight (bilateral). (A) 53% of the variation in hippocampal weight is explained by brain weight. (B) 47% of the variation in hippocampal weight is explained by brain minus hippocampal weight. There are no significant differences in brain weight among our sample of mice. In this and other parts of Figure 2 males and females are coded as blue crosses and red circles, respectively.
Body weight and hippocampal weight
Body weight and hippocampal weight are correlated among BXD mice (r = 0.42, Table 2, Fig 2C). A 1 g increase in body weight is associated with a 0.19 ± 0.03 mg increase in hippocampal weight (Fig. 2C). However, there is no significant correlation when brain weight is used as a cofactor in a multiple regression analysis (Fig. 3B). In F2 mice body weight correlates even more weakly with hippocampus (r = 0.23), and variation in body weight accounts for only 5% of variation in hippocampal weight. A 1 g increase in body weight is associated with a 0.10 ± 0.03 mg increase in hippocampal weight.
Figure 2C. Body weight effects on the hippocampal weight. Note the large sex difference in body weight. (C) Body weight is significantly correlated with hippocampal weight. (D) X and Y axes represent body and hippocampus residuals respectively, after correction for covariation with brain weight.
Age and hippocampal weight
The weight of the hippocampus increases markedly with age. Among BXD
individuals that ranged in age from 30 to 300 days, the slope of this
increase is 3.4 mg (~15%) for a 10-fold increase in age. Mice are sexually
mature by 50 days of age, and over the next 200 days the summed weight of
the hippocampi increases by 2.5 mg, or close to 10%. Variation in age
among BXD mice accounts for 9% of the variance in hippocampal weight.
In the BXD animals the weights of both the forebrain and the
hippocampus increase with age. However, the effect of age on the
hippocampal weight is not explained completely by a general increase in
forebrain weight. The slope of the regression of hippocampus against age
remains significant (t(247) = 4.0, p < 0.0001)
but decreases from 3.9 to 2.2 ± 0.5 mg /log unit age when forebrain weight
is added as a cofactor (Fig. 2F). For the sample of F2 progeny there is a
significant upward trend in hippocampal weight between 75 and 150 days
that amounts to ~0.02 mg/day (R2 = 3%, p <
0.05). In contrast to the BXD sample, there is no greater proportional
increase in hippocampal weight of the F2 sample than in the remainder of
the forebrain.
Figure 2E and F. Age effects on the hippocampus. X and Y axes represent the logarithm of age and hippocampus residuals respectively. (E) Age is significantly correlated with hippocampal weight. (F) Age remains significantly correlated with hippocampal weight after accounting for variation in forebrain minus hippocampus. m is regression line for male; f is regression line for female.
Sex and hippocampal weight
Hippocampi of male mice typically weigh 0.50 to 0.60 mg more than those of female mice in the BXD sample and F1 and F2 intercrosses (p < 0.01). Despite differences in body weight, male and female mice have almost precisely the same brain weight—422.7 ± 3.9 versus 422.8 ± 3.0 mg, respectively, for the BXD sample. The difference in hippocampal weight is therefore a relatively specific CNS sex difference. Although statistically significant, the 2% mean difference in hippocampal weight between sexes is relatively trivial given the other numerous sources of variance. This difference should not be characterized as a sexual dimorphism—the overlap between sexes is vast, and sex accounts for only 2% of the total variance in hippocampal weight.
Comparison of right and left sides
Measured differences in weights of right and left hippocampi are due to biological differences and technical error. The mean difference between the two sides averages 0.3 mg. Following a correction for small n, this corresponds to a right-left coefficient of variation of merely 2% (Gurland and Tripathi correction; Sokal and Rohlf, 1995). This value sets an upper limit on the magnitude of variation generated by developmental noise and the magnitude of error introduced by fixation and dissection technique. The mean weights of right and left hippocampi across all BXD and F2 mice differ by only 0.05 mg. The right side is on average 0.4% heavier. This tiny difference does reach statistical significance (paired t(4,30) = 2.4; p = 0.012), but it is possible that a slight technical bias is introduced during dissection.
Table 2. Correlation matrix of ten parameters for individual BXD animals
Multiple regression analysis
To map QTLs that have relatively specific or intense effects on the hippocampus—as opposed to whole brain weight and other extraneous variables—we corrected all original hippocampal weight data by multiple linear regression using the equation
hippocampal weight (bilateral, fixed in mg) = 4.57 + 1.05 (logarithm of age in days) – 0.004(body weight in gm) + 0.048 (brain weight – hippocampal weight in mg) – 0.56 (if female)
This equation accounts for ~50% of the variance among BXD cases (F(4,246) = 59.5). We refer to these regression-corrected values as adjusted hippocampal weights (Table 1, column 3). The adjusted weights represent the weight of the hippocampus after removing predictable effects of sex, brain size, age, and body size. These corrected values were used for mapping QTLs that have comparatively specific effects on the hippocampus. The adjusted hippocampal weight averages 26.1 ± 0.4 mg and ranges from a low of 23.5 mg in BXD32 to a high of 30.8 mg in BXD40. This range extends below the adjusted value of the parental strain DBA/2J (26.4 mg) and far above the value of parental strain C57BL/6J (27.4 mg). A similar multiple linear regression model was used to create a set of adjusted values for the F2 mice (F2 data in text format for all cases):
hippocampal weight (fixed in mg) = 2.81– 1.35 (logarithm of age in days) + 0.017(body weight in gm) + 0.063 (brain weight – hippocampal weight in mg) – 0.52 (if female)
This equation accounts for ~53% of the variance among the F2 sample. The mean of the adjusted weights for the F2 mice was 26.7 ± 0.1. The cumulative probability density plot for the F2 sample after adjustment is unimodal and slightly steeper (leptokurtic) than a normal distribution.
Heritability of hippocampal weight variation
An analysis of variance of BXD mice indicates that the broad-sense heritability for variation in hippocampal weight computed using the method of Hegmann and Possidente (1981) ranges from 44 to 51%. The corresponding estimate of broad sense heritability derived by comparing variance of F1 and F2 animals is 35%. Using the Castle-Wright equation (Wright, 1978) we estimate that a minimum of 3 to 7 loci contribute to the increased variance in F2 progeny compared to their F1 parents. As we show below, we have been able to map two of these factors or QTLs.
Volumetric analysis of the hippocampus
The volume of the hippocampus and several major components were estimated to screen for interesting strain differences as well as to assess the specificity of gene effects. Regions that were measured include the entire hippocampal formation (a measure that corresponds to hippocampal weight; see Methods section), the hippocampus proper (a measurement that excludes the dentate gyrus), the pyramidal cell layer of CA1 through CA3, the dentate gyrus, and the granule cell layer of the dentate gyrus. We find significant differences among BXD and parental strains for each hippocampal component: the total hippocampal complex (R2 = 54%, F(32,135) = 5, p < 0.0001), the hippocampus proper (R2 = 53.6%, F(32,135) = 4.9, p < 0.0001), the dentate gyrus (R2 = 53%, F(32,135) = 4.8, p < 0.0001), the granule cell layer (R2 = 44%, F(32,135) = 3.3, p < 0.0001), and the pyramidal layer (R2 = 51%, F(32,135) = 4.4, p < 0.0001). We also find that the volume of each part correlates significantly with the volume of the total hippocampus. Correlations range from 0.76 to 0.93 (Fig 3). An interesting aspect of this work is that the relative size of the four components differ appreciably among strains. For example, the volume of the dentate gyrus in strains that have almost precisely the same total hippocampal volume ranges from 3.7 mm3 to 4.5 mm3 (Fig 3A, see BXD2 and BXD9). Similarly, the pyramidal cell volume ranges from 1.1 mm3 to 1.7 mm3 among strains with essentially the same hippocampal volume (Fig 3B).
Figure 3A. Relations between volume of hippocampus and volume of the dentate gyrus.
Figure 3B. Relations between volume of hippocampus and volume of the pyramidal cell layer, including CA1 through CA3.
Figure 3C. Relations between volume of hippocampus and the volume of the granule cell layer of the dentate gryus.
Figure 3D. Relation between granular layer volume and granular cell density. All volumetric data are corrected for differential shrinkage.
Stereological analysis of the dentate granule cell layer
The average packing density of granule cells in the dentate gyrus of BXD RI strains ranges from 750,000 to 1,050,000 cells/mm3. Standard errors of these estimates average 60,000 cells/mm3. Variation in density is not correlated with the total volume of whole brain, hippocampus, dentate gyrus, or even the volume of the granule cell layer itself (Fig. 3D). However, there is a good correspondence between estimates of granule cell number in the two parental strains and the weight of the hippocampus (Table 1). Similarly, there is a significant correlation between estimates of granule cell number and dentate gyrus volume and total hippocampal volume (r = 0.77 and 0.70, respectively). Bilateral estimates of cell number range from just over 1,000,000 cells in BXD1, BXD8, BXD14, and BXD19 to under 700,000 in BXD2, BXD27, BXD29, and BXD34 (Table 1). The magnitude of this difference is as great as differences in retinal ganglion cell number among the same strains of mice (Williams et al., 1998).
QTL Analysis of the Mouse Hippocampus
Mapping hippocampal QTLs using BXD mice
Among the BXD strains we detected an excellent match between variation
in hippocampal weight and the distribution of B and D alleles at the
marker D1Mit145 on distal Chr 1 (Table 1). The average corrected
hippocampal weights for 17 BXD strains with a B/B genotype at this locus
was 27.05 ± 0.35 mg, whereas that for 18 strains with a D/D genotype was
25.09 ± 0.23 mg. A single B allele in this interval on Chr 1 therefore has
an additive effect of approximately +1.0 mg on hippocampal weight. The
correlation between hippocampal weight and alleles at D1Mit145 is 0.63
(Table 1), suggesting that as much as 40% of the genetic variance and
15–20% of the total phenotypic variance is generated by a QTL on Chr 1.
The association between differences in hippocampal weight and alleles
on Chr 1 is strong and has a likelihood ratio statistic (LRS) of 19.9
(genome-wide p < 0.05), equivalent to a LOD score of 4.2 (Fig. 4A) between
the loci D1Mit145 (89 cM) and D1Mit113 (92 cM). The 2-LOD confidence
interval, the chromosomal region in which the QTL is located with a
confidence of approximately 95%, extends from D1Mit446 at 70 cM (LRS or
4.5) to D1Mit291 at 101 cM (LRS of 7.8). We have named this locus
Hippocampus 1. The abbreviated form or symbol for this QTL is Hipp1.
Hipp1 is a robust QTL in the sense that it is detected even using the
original hippocampal weight values that do not factor out differences in
brain weight. However, the linkage statistics are about 10-fold weaker
with a peak LRS of 14.7 at 72 cM on Chr 1 near D1Mit194.


Figure 4. Interval maps of QTLs on Chr 1 (A, B) and Chr 5 (C, D, E, F) in BXD and F2. In each of the six plots, the left axis and bold black line represent values of the likelihood ratio statistic (LRS) computed at 1 cM intervals for hippocampal weight (residuals). The right axis and the thin line represent values for the additive effect of the substitution of a single D allele with a B allele. The X axis represents the entire genetic lengths of Chr 1 (A, B) and Chr 5 (C, D, E, F). Positions of several markers used for mapping both QTLs (e.g., D1Mit200, D5Mit356) are labeled on the X axes. The approximate 2-LOD confidence band is represented by a gray horizontal bar. Plots A, B, C, D are simple interval maps whereas E, F are composite interval maps that control for the Hipp1 interval (D1Mit145 region) of Chr 1.
We have recently generated high density maps for BXD strains that are available as text files for use with Map Manager. These files include some of the phenotype data listed in Table 1 and can be use to verify and extend the main results of this QTL analysis. Please note that Figure 4 was prepared with a more limited set of about 340 BXD genotypes and the LRS plots that are obtained with the new data will have different contours. However, the results and statistics are not affected.
BXD data in Map Manager text format. 36 progeny. Alleles are coded B,
D, H, and U (for untyped).
F2 data in Map Manager text format. 183 progeny. Alleles are coded B,
D, H, and U.
We controlled for variation generated by the Hipp1 interval on Chr 1
and searched for secondary QTLs affecting hippocampal weight. This
procedure uncovered an interval on Chr 5 that is flanked proximally by
D5Mit352 (20 cM) and distally by D5Mit356 (41 cM). The LRS score in this
interval peaks at 11.0 (Fig. 4E). The genome-wide p is 0.24 and falls
short of the level needed to declare a QTL. We subsequently verified the
position of this Chr 5 QTL and that on Chr 1 with the F2 intercross.
The composite mapping procedure was then reversed: we controlled for
the Chr 5 interval and remapped Chr 1. LRS values on Chr 1 were still very
high, but now in two locations—the original interval near D1Mit145 (LRS of
21.0) and a slightly more proximal region centered at D1Mit45 (59 cM; LRS
of 21.6).
Mapping with the F2 Intercross
The hippocampi of F2 progeny were analyzed to extend and validate the
analysis of BXD strains. A linkage between weight of the hippocampus was
again discovered on distal Chr 1, with a peak LRS of 34.0 between marker
D1Mit57 and D1Mit145 (Fig. 4B). This linkage statistic is highly
significant with a genome-wide p of ~ 0.0001. The 2-LOD confidence
interval on Chr 1 is approximately 25 cM wide and extends from 70 to 95 cM
and bracketed by the markers D1Mit103 and D1Mit356. Individuals with B/B,
B/D, and D/D genotypes at D1Mit145, the key marker locus identified in the
BXD data set, have mean adjusted hippocampal weights of 27.43 ± 0.20 mg,
26.72 ± 0.11 mg, and 26.16 ± 0.16 mg, respectively. Hipp1 is responsible
for ~14% of the total phenotypic variance in hippocampal weight. The
additive effect of a single B-to-D allele substitution is about 0.64 mg.
This is a slightly more modest effect than that noted in the BXD strains
at D1Mit145 (27.04 and 25.08 mg for B/B and D/D genotypes).
The Hipp2 locus on proximal Chr 5 was also confirmed using the F2
intercross. This Chr 5 interval has LRS scores of 12.6 at D5Mit345 and
11.8 at D5Mit352 (Fig. 4D). When variation associated with Hipp1 is
controlled the LRS at D5Mit352 increases to between 15 and 20 depending on
the particular set of distal Chr 1 loci used as cofactors. For example,
using only D1Mit145 gives the most conservative LRS of 15.9 (Fig. 4F),
whereas controlling for all markers between 50 and 100 cM (D1Mit80, 387,
103, 57, 145, and 356) raises the composite score to 19.9. Mean adjusted
hippocampal weights of the B/B, B/D, and D/D genotypes at D5Mit346 are
approximately 27.3, 26.6, and 26.5 mg (ANOVA F(2,174)
= 6.0, p = 0.003). The B allele at Hipp2 is fully dominant. When data from
BXD and F2 sets are combined, Hipp2 is most likely to map between 15 and
40 cM on Chr 5 (genome-wide p < 0.05).
Test of epistasis between Hipp1 and Hipp2
As judged by their effects in the BXD strains, Hipp1 and Hipp2 alleles sum almost linearly. Those strains with B alleles at both loci (B/B-B/B) have hippocampi that weigh 3.1 mg (12%) more than those of BXD strains with D alleles. The predicted summed effect is 3.5 mg. Residual hippocampal weights for the four possible two-locus genotypes are 1.7 mg (B/B-B/B at Hipp1 and Hipp2), 0.27 (B/B-D/D), –0.25 (D/D-B/B) and –1.4 (D/D-D/D). The same general pattern characterizes F2 animals. Those with B alleles on both Chr 1 and Chr 5 have hippocampi that weigh more than those of F2 animals with D alleles (Table 3). The double heterozygote is within 0.1 mg of the mean of all cases. The predicted linear sum of B alleles at the two loci is 2.1 mg. There is evidence of non-linear interaction between Hipp1 and Hipp2 in the F2 cross—animals with the D/D-B/D two-locus genotype at D1Mit57 and D5Mit346 have a lower mean weight (a residual of —1.13 mg) than even the D/D-D/D animals (—0.51 mg). This suggests that the heterozygous Hipp2 genotype may interact epistatically with Hipp1 to modulate hippocampal size. Another way of expressing this is that the D allele at Hipp2 is overdominant when combined with a homozygous D genotype at Hipp1.
Table 3: Potential interactions between Hipp1 and Hipp2
|
D1Mit57 |
D5Mit346 |
N |
Mean Residual* |
|
B |
B |
15 |
1.057 |
|
B |
H |
17 |
0.509 |
|
B |
D |
11 |
0.668 |
|
H |
B |
13 |
0.459 |
|
H |
H |
47 |
-0.117 |
|
H |
D |
18 |
-0.312 |
|
D |
B |
15 |
-0.013 |
|
D |
H |
21 |
-1.133 |
|
D |
D |
12 |
-0.505 |
*Residual weight values in milligrams for both sides.
Genotypes for the two loci: B = B/B; H = B/D; D = D/D
N is the number of F2 individuals with a particular two-locus genotype.
Specificity of QTL action
Hipp1 is defined as a QTL that modulates total hippocampal weight, but it is possible that this locus has more intense effects on one or more parts of the hippocampus, such as the dentate gyrus. To test this possibility we mapped volumetric data from the independent set of BXD data. The top four panels of figure 5 (A–D) demonstrate that volumetric data also show linkage to Chr 1. There is concordance in the locations of peak LRS scores for hippocampal volume (A), pyramidal cell layer volume (B), granule cell layer volume (C), dentate gyrus volume (D), and mossy fiber area (E, our reanalysis of data from Lassalle, et al., 1999). The important point is that in all of these maps the LRS peaks between 65 and 85 cM, the same interval defined as the location of Hipp1 in figure 4 using our more extensive hippocampal weight data set. This is also true of the untransformed and uncorrected cell counts from the dentate gyrus. Peak LRS values for all of these traits have point-wise probabilities less than 0.05, and less then 0.001 in the case of mossy fiber area. There is a similar concordance between the position of Hipp2 on Chr 5 for weight (Fig. 6) and the peak LRS for volume of total hippocampus, the dentate gyrus, the granular layer, and the pyramidal layer. This suggests that Hipp2 also has broad effects on hippocampus structure.

Figure 5. Interval maps for five different hippocampal traits on maps of Chr 1 derived from the BXD strains. The X axes represents the entire genetic length of Chr 1. Y axes represents values for the likelihood ratio statistic (LRS) computed at 1-cM intervals. A, hippocampal volume; B, pyramidal cell layer volume (CA1-CA3); C. Granule cell layer volume of the dentate gyrus; D. Volume of the dentate gyrus (excludes part of the hilus); E. cross-section area of the mossy fiber projection (from Lassalle et al, 1999).
Figure 6. Interval map of QTL on Chr 5. X axes represents the entire genetic length of Chr 5. Y axes represents values for the likelihood ratio statistic (LRS) computed at 1 cM intervals. Conventions as in figure 7.
The relation between the two Hipp loci and granule cell number
indicates that these two intervals are responsible for generating
differences of just over 100,000 cells per dentate gyrus (200,000
bilaterally). Two markers in the Hipp1 and Hipp2 intervals—D1Mit218 and
D5Mit197—collectively account for 28% of the variance in granule cell
number (Table
1) among the BXD strains means (F(30,2) =
7.1, p = 0.007 and LS of 7.5 at D1Mit218, p = 0.039 at D5Mit197). It is
therefore highly likely that Hipp1 has broad effects on all parts of the
hippocampus that we measured, affecting both volume and neuron numbers.
The bottom panels in figure 5 and 6 (5E and 6E) illustrate one of the
unique advantages of gene mapping using recombinant inbred strains. We
have remapped data published by Lassalle and colleagues (1999) on the area
of the mossy fiber projection in BXD strains. Our remapping demonstrates
that Hipp1, and possibly Hipp2, act to control the volume of the mossy
fiber projection, a finding not unexpected given the wide range in the
granule cell populations among BXD strains.
Increasing specificity by controlling for covariation with cerebellar weight
In our analysis of the F2 intercross we discovered that hippocampal residuals were negatively correlated (r = –0.15) with cerebellar weight residuals that had been computed using similar procedures (Airey et al., 1999). The slope of this relation is modest, and after all corrections have been made there is merely a 0.05 mg increase in hippocampal weight for a 1 mg increase in cerebellar weight (p = 0.04, R2 = 2%). Nonetheless, we decided to include cerebellar weight as a cofactor in computing adjusted hippocampus weights for the F2 set. These latter values were used to map QTLs with improved specificity for the hippocampus in the F2 set. Mapping these cerebellum-corrected scores revealed linkage to a somewhat more proximal region of Chr 1, circa 50–60 cM. The LRS peaks at 27.6 at D1Mit80 located at ~53 cM. A more distal peak that corresponds to Hipp1 is still located near D1Mit57 and D1Mit145 and has a peak LRS of 28.2. Both the more proximal and more distal intervals are significant and have genome-wide p < 0.0005. QTLs defined using F2 intercrosses are often mapped with poor precision (Darvasi, 1998), and it is possible that only a single QTL affecting hippocampal weight maps to Chr 1. However, it is also possible that two linked QTLs are located on Chr 1 between 50 and 100 cM, and that these QTLs are collectively responsible for the genetic variation in hippocampal weight and the high LRS scores on distal Chr 1. This suggestion is supported by the BXD mapping results that are also consistent with a pair of loci located at about 60 and 90 cM. High resolution mapping with a tenth generation advanced intercross that we have recently generated will resolve this intriguing problem.
Discussion
Synopsis
We have mapped gene loci with pronounced effects on hippocampal structure to chromosomes 1 and 5 in mouse. Hipp1 and Hipp2 are the first loci known to modulate normal variation in the size of any part of the mammalian forebrain. While effects of QTLs are relatively modest in comparison to the dramatic effects noted in some knockouts and spontaneous mutations, these QTLs have effects that exceed those generated by sex, age, or body weight. It is possible, even likely, that 10–15% shifts in hippocampal weight and neuron number might have functional consequences. This work represents a key step to characterizing genes that normally modulate proliferation, growth, and maturation of the hippocampus. The volumetric and stereological analyses of the Hipp loci demonstrate that these loci have widespread effects on hippocampal structure, including an effect on at least one well-defined hippocampal cell population. The biometric analysis also suggests that age, and to a lesser extent sex, are important factors influencing hippocampus size. A surprising 10% increase in hippocampal weight characterizes sexually mature mice between 50 and 150 days of age.
Relations between structure and function
A series of studies has confirmed the existence of heritable differences in the development of the hippocampus (Symons et al., 1988; Lipp et al., 1989). This work has also shown a rough correspondence between hippocampal structural variation and learning ability among different strains of mice, particularly spatial and contextual learning ability (Crusio et al., 1986; Lipp et al., 1989). We find that the hippocampus of C57BL/6J is approximately 5 mg (20%) heavier than that of DBA/2J. At the level of single gene loci, the hippocampus of F2 progeny that have inherited both Hipp1 alleles from C57BL/6J are 1.3 mg heavier than those of progeny that have inherited alleles from DBA/2J. Upchurch and colleagues (1989) examined the inheritance of spatial learning and found that C57BL/6 mice are significantly better at spatial learning than DBA/2 mice. Several studies have also shown that the mossy fiber projection to CA3 is more extensive in C57BL/6 than in DBA/2J mice (Crusio et al., 1989; Schopke et al., 1991). We now add a 20% difference in granule cell number to this list of differences between the parental stains. The involvement of the projection from dentate gyrus to CA3 in learning and memory has been demonstrated in a variety of tasks (Schwegler et al., 1983, Roullet et al., 1990; Bertholet et al., 1991; Flint et al., 1995). It is plausible that allelic differences at Hipp1 and Hipp2 are functionally related to hippocampal-dependent behavioral differences. Of particular interest, Hipp1 maps to the same part of Chr 1 known to harbor one of more QTLs for contextual learning in mice, a hippocampal dependent behavior (Owen et al., 1997; Wehner et al., 1997; Calderone et al., 1997).
Behavioral QTLs associated with Hipp1
In recent quantitative genetic studies of contextual conditioning, a learned behavior that depends on the hippocampus, a set of behavioral QTLs have been identified using precisely the same crosses—BXD and B6D2F2—that we have used (Owen et al., 1997; Wehner et al., 1997). One of the most significant and well-replicated QTLs identified in these studies is located on Chr 1 at 80 ± 10 cM (Flint et al., 1995; Calderon et al., 1997; Owen et al., 1997; Wehner et al., 1997). The chance that the position of our strongest morphometric QTL, Hipp1, would match that of the single best behavioral QTL is small—this common 20 cM interval makes up less than 2% of the mouse genome. The D allele at the learning locus on distal Chr 1 is strongly dominant and is associated with greater responsivity to a fearful context. In contrast, alleles at Hipp1 behave in an almost perfectly additive manner and the D allele in this case is associated with a smaller hippocampus. These differences argue either that Hipp1 and the contextual learning QTL are different loci or effects of alleles on anatomical and behavioral traits are not linearly related.
Specificity or selectivity of QTL action
What assurance do we have that the QTLs we have mapped have specific
effects on hippocampus and not widespread effects on many parts of the
CNS? As a first line of defense we mapped hippocampal residualsÑthe signal
that remains after controlling for major factors, particularly brain
weight, age, and sex. As a second line of defense we have directly mapped
QTLs that modulate total brain weight and compared these QTLs with those
that modulate hippocampus. Major brain weight QTLs map to Chrs 6, 7, 11,
and 14 (Strom, 1999; Williams 2000). Ongoing analysis of the F2 intercross
used in the present study indicates that there is a brain weight QTL on
Chr 1 and it is possible that Hipp1a has especially intense effects on the
hippocampus and less intense and possibly widespread effects on other
forebrain derivatives. QTLs will often have graded effects on different
CNS components. This leads to our third line of defense: mapping QTLs that
control other CNS regions in the same crosses. Hipp1a and Hipp5a do not
correspond to any of the olfactory bulb or cerebellar QTLs we have mapped
in BXD and the F2 crosses (Williams et al.,
2001, Airey et al.,
2001). Hipp1a and a cerebellar QTL, Cbs1a, both map to distal Chr 1
but B6 and D2 alleles at these two QTLs have opposite effect polarities
arguing against a common gene.
Regional volumetric and stereological analyses of the hippocampus
indicates that Hipp1 and Hipp2 both influence multiple parts of the
hippocampus. The correlation between genotype at either locus and
phenotypic measures in BXD mice was significant for all the hippocampal
traits, including total hippocampus weight, volume of the hippocampus
proper, volumes of the dentate gyrus and the granule and pyramidal cell
layers, and granule cell population. Even an axon-projection specific
phenotypeÑthe area of the mossy fiber projection to CA3 as measured by
Timm's stain, significantly correlates to the Hipp1 locus (Lassalle et
al., 1999). Thus the QTLs at these loci seem to affect adult hippocampus
size selectively, but have shared effects that modulate major parts of the
hippocampus.
Candidate genes for Hipp1 and Hipp2
Hipp1 maps in the same region as the retinoid x receptor gamma (Rxrg)
gene (88 cM) on distal chromosome 1. During brain development, RXRg
and retinoid-binding proteins are expressed in CA1–CA3 and the hilus (Zetterstrom
et al., 1999). There is evidence that allelic variants at this gene
modulate hippocampal development. RXRg is
expressed in the adult murine hippocampus (Zetterstrom et al., 1999) and
in Rxrg knockout mice, maze learning performance is compromised
(Chiang et al., 1998), a finding that suggests that RXRg
is at least partly involved in hippocampal spatial learning and memory. It
will be interesting to determine 1. if this gene is polymorphic between
C57BL/6J and DBA/2J, and 2. if the Rxrg
knockout has an effect on hippocampal weight, volume of hippocampal
regions, or on neuron number.
Gene expression profiling is already beginning to identify
polymorphic candidate genes in intervals that harbor QTLs. Sandberg,
Yasuda, Barlow and colleagues (2000)
compared mRNA expression levels of 13,000 genes in the hippocampus of
C57BL/6Tac and 129S6/SvEvTac. Their work highlighted an inward rectifying
potassium channel gene (Kcnj9 or Girk3) that maps to distal Chr 1 (94 cM)
and that is expressed at much lower levels in C57BL/6 than in 129S6/SvEvTac.
Kcnj9 is probably too distal to be a prime candidate for Hipp1, but this
example illustrates the growing power of QTL analysis when combined with
gene array comparisions between parental strains.
Both BXD and F2 data sets indicate that Hipp2 maps between 15 and 40
cM on Chr 5. This region contains two candidates—Fgfr3 at 20 cM and a
cluster of GABA receptor genes at 40 cM. These genes are expressed in the
hippocampus during development and at maturity (Asai et al., 1993; Peters
et al., 1993; Mohler et al., 1990; Gaiarsa et al., 1995). FGFR3 and two of
its ligands (FGF1 and FGF2) are expressed in hippocampus during
development. FGF-dependent mechanisms influence a wide variety of CNS
traits, including the survival, growth, and differentiation of hippocampal
neurons (Walicke et al., 1986; Sasaki et al., 1992). GABA receptors are
potential candidates because GABA is now known to have a trophic role in
morphological development of hippocampal neurons (Barbin et al., 1993).
With such a roughly defined QTL interval there are of course numerous
other genes, many presumably still entirely unknown that may influence
hippocampal development.
Hippocampal size and sex differences
Polygamous male voles traverse large home ranges in search of mates (Jacobs et al., 1990). Polygamous kangaroo rats also exhibit a sex difference in home range size (Jacobs et al., 1994). Hippocampi of males are typically 10 to 15% larger than those of females. In these polygamous species, an increase in the size of the hippocampus is associated with superior spatial ability (Sherry et al., 1992; Jacobs et al., 1990). We found a smaller sex difference in laboratory mice that conforms to the pattern seen in wild rodent species—the hippocampus of males is about 0.5 mg heavier (bilateral), a difference of only 2%. However, this difference may be highly dependent on strain background. As much as a 15% difference in granule cell number was discovered between males and females of strain LG/J, whereas no significant sex difference was discovered in C58/J mice (Wimer and Wimer, 1985, 1989).
Age-related changes in hippocampal weight and adult hippocampal neurogenesis
Neurogenesis occurs in the dentate gyrus of the hippocampus throughout the life of a rodent (Kaplan et al., 1984; Kuhn et al., 1996). Kempermann et al. (1997b) reported that 3-month-old mice produce at least 1 new neuron per 2000 granule cells per day. Assuming complete additivity rather than turnover, this is equivalent to a 10% gain over 200 days. In mice, total granule cell number increases into midlife and then reaches a stable plateau (Kempermann et al., 1998). We have discovered a 10% gain in hippocampal weight over a 200-day period in adult mice. This correspondence is probably fortuitous, particularly so since the dentate gyrus—the only region with notable adult cell production—makes up a small fraction (~20%) of the hippocampal weight.
Kempermann and colleagues (1997b) have shown that the production of new neurons in adults differs significantly among strains of mice, including those we have use in this study. Hipp1 and Hipp2 are both interesting candidates that may influence neurogenesis. It would be feasible to test whether allelic variants at these QTLs modulate levels or kinetics of neurogenesis in the adult mouse. The analysis would rely on identifying 10 to 20 mice homozygous for either B or D alleles at the Hipp1 and Hipp2 intervals and phenotyping these genetically defined animals as adults. Just as is true of Mendelian mutations, an analysis of the functional role of allelic variants at QTLs can precede cloning. In fact, functional and developmental studies of QTLs (Strom and Williams, 1999) can greatly aid in narrowing the set of candidate genes that subsequently need to be analyzed in detail.
Acknowledgments
This research project was support by a grant from the National Institute of Neurological Disorders and Stroke (R01 NS35485). The authors thank Drs. Guomin Zhou, Jing Gu, and Xiyun Peng for their assistance in generating, processing, genotyping F2 and BXD mice. We thank Dr. Anand Kulkarni, Toppy Malasri, and David Seecharan for their assistance in the stereological analysis of the dentate gyrus. We thank Dr. Wim Crucio for helpful comments on this work.
References
Abusaad I, MacKay D, Zhao J, Stanford P, Collier DA, Everall IP (1999) Stereological estimation of the total number of neurons in the murine hippocampus using the optical disector. J Comp Neurol 408:560–566.
Airey DC, Lu L, Williams RW (2001) Genetic control of the mouse cerebellum: Identification of quantitative trait loci modulating size and architecture. J Neurosci XX:XXXÐXXX.
Altman J, Das GD (1965) Autoradiographic and histological evidence of postnatal hippocampal neurogenesis in rats. J Comp Neurol 124:319–335.
Asai T, Wanaka A, Kato H, Masana Y, Seo M, Tohyama M (1993) Differential expression of two members of FGF receptor gene family, FGFR-1 and FGFR-2 mRNA, in the adult rat central nervous system. Brain Res Mol Brain Res 17:174–178.
Barber RP, Vaughn JE, Wimer RE, Wimer CC (1974) Genetically-associated variations in the distribution of dentate granule cell synapses upon the pyramidal cell dendrites in mouse hippocampus. J Comp Neurol 156:417–434.
Barbin G, Pollard H, Gaiarsa JL, Benari Y (1993) Involvement of GABAA Receptors in the outgrowth of cultured hippocampal neurons. Neurosci Lett 152:150–154.
Bayer SA (1982) Changes in the total number of dentate granule cells in juvenile and adult rats: a correlated volumetric and 3H-thymidine autoradiographic study. Exp Brain Res 46:315–323.
Belknap JK, Hitzemann R, Crabbe JC, Phillips TJ, Buck KJ, Williams RW (2001) QTL analysis and genome-wide mutagenesis in mice: complementray genetic approaches to the dissection of complex traits. Behav Genet 31:XXXÐXXX.
Bertholet JY, Crusio WE (1991) Spatial and non-spatial spontaneous alternation and hippocampus mossy fiber distribution in nine inbred mouse strains. Behav Brain Res 43:197–202.
Bishop KM, Wahlsten D (1999) Sex and species differences in mouse and rat forebrain commissures depend on the method of adjusting for brain size. Brain Res 815:358–366.
Caldarone B, Saavedra C, Tartaglia K, Wehner JM, Dudek BC, Flaherty L (1997) Quantitative trait loci analysis affecting contextual conditioning in mice. Nat Gen 17:335–337.
Cameron HA, Woolley CS, McEwen BS, Gould (1993) Differentiation of newly born neurons and glia in the dentate gyrus of the adult rat. Neurosci 56:337–344.
Chiang MY, Misner D, Kempermann G, Schikorski T, Giguere V, Sucov HM, Gage FH, Stevens CF, Evans RM (1998) An essential role for retinoid receptors RARb and RXRg in long-term potentiation and depression. Neuron 21:1353–1361.
Churchill GA, Doerge RW (1994) Empirical threshold values for quantitative trait mapping. Genetics 138:963–971.
Crusio WE, Genthner-Grimm G, Schwegler H (1986) A quantitative-genetic analysis of hippocampal variation in the mouse. J Neurogen 3:203–214.
Crusio WE, Schwegler H, van Abeelen JHF (1989) Behavioral responses of novelty and structural variation of hippocampus in mice: II. Multivariate genetic analysis. Behavior Brain Res 32:81–88.
Csernansky JG, Joshi S, Wang L, Haller JW, Gado M, Miller P, Grenander U, Miller MI (1998) Hippocampal morphometry in schizophrenia by high dimensional brain mapping. Proc Natl Acad Sci USA 95:11406–11411.
Darvasi (1998) Experimental strategies for the genetic dissection of complex traits in animals. Nat Gen 18:19–24.
De Bellis MD, Clark DB, Beers SR, Soloff PH, Boring AM, Hall J, Kersh A, Keshavan MS (2000) Hippocampal volume in adolescent-onset alcohol disorders. Am J Psych 157:737–744.
Dietrich WF, Katz H, Lincoln SE (1992) A genetic map of the mouse suitable for typing in intraspecific crosses. Genetics 131:423–447.
Don RH, Cox PT, Wainwright BJ, Baker K, Mattick JS (1991) ‘Touchdown’ PCR to circumvent spurious priming during gene amplification. Nucleic Acids Res 19:4008.
Flint J, Corley R, DeFries JC, Fulker DW, Gray JA, Miller S, Collins AC (1995) A simple genetic basis for a complex psychological trait in laboratory mice. Science 269:1432–1435.
Gaiarsa JL, McLean H, Congar P, Leinekugel X, Khazipov R, Tseeb V, Ben-Ari Y (1995) Postnatal maturation of gamma-aminobutyric acid A and B-mediated inhibition in the CA3 hippocampal region of the rat. J Neurobiol 26:339–349.
Gould E, Caneron HA, McEwen BS (1994) Blockade of NMDA receptors increases cell death and birth in the developing rat dentate gyrus. J Comp Neurol 22:551–565.
Haley CS and Knott SA (1992) A simple regression method for mapping quantitative trait loci in line crosses using flanking markers. Heredity 69:315–324.
Hatton WJ, von Bartheld CS (1999) Analysis of cell death in the trochlear nucleus of chick embryos: calibration of the optical disector counting technique reveals systematic bias. J Comp Neurol 409:169–186.
Hegmann JP, Possidente B (1981) Estimating genetic correlations from inbred strains. Behav Genet 11:103–114.
Jacobs LF, Gaulin SJC, Sherry DF, Hoffman GE (1990) Evolution of spatial cognition: sex-specific patterns of spatial behavior predict hippocampal size. Proc Natl Acad Sci USA 87:6349–6352.
Jacobs LF, Spencer WD (1994) Natural space-use patterns and hippocampal size in kangaroo rats. Brain Behav Evol 44:125–132.
Kaplan MS, Bell DH (1984) Mitotic neuroblasts in the 9-day-old and 11-month-old rodent hippocampus. J Neurosci 4:1429–1441.
Kempermann G, Kuhn HG, Gage FH (1997a) More hippocampal neurons in adult mice living in an enriched environment. Nature 386:493–495.
Kempermann G, Kuhn HG, Gage FH (1997b) Genetic influence on neurogenesis in the dentate gyrus of adult mice. Proc Natl Acad Sci USA 94:10409–10414.
Kempermann G, Kuhn HG, Gage FH (1998) Experience-induced neurogenesis in the senescent dentate gyrus J Neurosci 18:3206–3212.
Kuhn HG, Dickinson-Anson H, Gage FH (1996) Neurogenesis in the dentate gyrus of the adult rat: age-related decrease of neuronal progenitor proliferation. J Neurosci 16:2027–2033.
Kuhn HG, Winkler J, Kempermann G, Thal LJ, Gage FH (1997) Epidermal growth factor and fibroblast growth factor-2 have different effects on neural progenitors in the adult rat brain. J Neurosci 17:5820–5829.
Kulkarni A, Airey DC, Williams RW (2000) Genetic architecture of the mouse retinogeniculate system: a QTL analysis of numerical matching. Soc Neurosci Abst 26: XXXX.
Lassalle JM, Halley H, Milhaud JM, Roullet P (1999) Genetic architecture of the hippocampus mossy fiber subfields in the BXD RI mouse strain series: a preliminary QTL analysis. Behav Genet 29:273–282.
Laird PW, Zijderveld A, Linders K, Rudnicki M, Jaenisch R, Berns A (1991) Simplified mammalian DNA isolation procedure. Nucleic Acids Res 19:4293.
Lipp HP, Schwegler H, Crusio WE, Wolfer DP, Leisinger-Trigona MC, Heimrich B, Driscoll P (1989) Using genetically-defined rodent strains for the identification of hippocampal traits relevant for two-way avoidance behavior: a non-invasive approach. Experientia 45:845–859.
Lipp HP, Wolfer DP (1998) Genetically modified mice and cognition. Curr Opin Neurobiol 8:272–280.
Love JM, Knight AM, McAleer MA, Todd JA (1990) Towards construction of a high resolution map of the mouse genome using PCR-analyzed microsatellites. Nucleic Acids Res 18:4123–4130.
Manly K (1993) A Macintosh program for storage and analysis of experimental genetic mapping data. Mamm Genome, 4: 303–313. in the adult mouse brain. Proc Natyl Acad Sci USA
Manly KF, Olson JM (1999) Overview of QTL mapping software and introduction to Map Manager QT. Mamm Genome, 10:327–334.
Mohler H, Malherbe P, Draguhn A, Richards JG (1990) GABAA –Receptors: structural requirements and sites of gene expression in mammalian brain. Neurochem Res 15:199–207.
Owen EH, Logue SF, Rasmussen DL, Wehner JM (1997) Assessment of learning by the Morris water task and fear conditioning in inbred mouse strains and F1 hybrids: implications of genetic background for single gene mutations and quantitative trait loci analyses. Neurosci 80:1087–1099.
Palmer TD, Takahashi J, Gage FH (1997) The adult rat hippocampus contains primordial neural stem cells. Mol Cell Neurosci 8:389–404.
Peters K, Ornitz D, Werner S, Williams L (1993) Unique expression pattern of the FGF receptor 3 gene during mouse organogenesis. Devel Biol 155:423–430
Rikke BA, Johnson TE (1998) Towards the cloning of genes underlying murine QTLs. Mamm Genome 9:963–968.
Rosen GD, Williams RW (2000) Stereological and quantitative genetic analysis of the mouse caudate nucleus. Soc Neurosci Abst 26:311.
Roullet P, Lassalle JM (1990) Genetic variation, hippocampal mossy fibers distribution, novelty reactions and spatial representation in mice. Behav Brain Res 41:61–69.
Routman E, Cheverud J (1994) A rapid method of scoring simple sequence repeat polymorphisms with agarose gel electrophoresis. Mamm Genome 5:187–188.
Sandberg R, Yasuda R, Pankratz DG, Carter TA, Del Rio JO, Wodicka L, Mayford M, Lockhart DJ, Barlow C (2000) Regional and strain-specific gene expression mapping in the adult mouse brain. Proc Natl Acad Sci USA 97: 11039–11043.
Sasaki K, Oomiya Y, Suzuki K, Hanal K, Yagi H (1992) Acidic fibroblast growth factor prevents death of hippocampal CA1 pyramidal cells following ischemia. Neurochem Int 21:397–402.
Schopke R, Wolfer DP, Lipp HP, Leisinger-Trigona MC (1991) Swimming navigation and structural variations of the infrapyramidal mossy fibers in the hippocampus of the mouse. Hippocampus 1:315–328.
Schwegler H, Lipp HP (1983) Hereditary covariations of neuronal circuitry and behavior: correlations between the proportions of hippocampal synaptic fields in the regio inferior and two-way avoidance in mice and rats. Behav Brain Res 7:1–38.
Sherry DF, Jacobs LF, Gaulin SJ (1992) Spatial memory and adaptive specialization of the hippocampus. Trends Neurosci 15:298–303.
Sokal RR, Rohlf FJ (1995) Biometry: the principles and practice of statistics in biological research. 3rd Ed. New York: WH Freeman.
Stanfield BB, Trice JE (1988) Evidence that granule cells generated in the dentate gyrus of adult rats extend axonal projections. Exp Brain Res 72:399–406.
Strom RC, Williams RW (1998) Cell production and cell death in the generation of variation in neuron number. J Neurosci 18:9948–9953.
Strom RC (1999) Genetic analysis of variation in neuron number. Dissertation, University of Tennessee, Memphis.
Symons JP, Davis RE, Marriott JG (1988) Water-maze learning and effects of cholinergic drugs in mouse strains with high and low hippocampal pyramidal cell counts. Life Sciences 42:375–383.
Tanksley SD (1993) Mapping polygenes. Annu Rev Genet 27:205–233.
Taylor BA (1989) Recombinant inbred strains. In: Genetic variants and strains of the laboratory mouse 2nd Ed (Lyon ML, Searle AG, eds), pp 773–796. Oxford: Oxford UP.
Upchurch M, Wehner JM (1989) Inheritance of spatial learning ability in inbred mice: a classical genetic analysis. Behavior Neurosci 103:1251–1258.
von Bartheld CS (1999) Systematic bias in an "unbiased" neuronal counting technique. Anat Rec (New Anat) 257:119–120.
Walicke P, Cowan WM, Ueno N, Baird A, Guillemin R (1986) Fibroblast growth factor promotes survival of dissociated hippocampal neurons and enhances neurite extension. Proc Natl Acad Sci USA 83:3012–3016.
Wehner JM, Radcliffe RA, Rosmann ST, Christensen SC, Rasmussen DL, Fulker DW, Wiles M (1997) Quantitative trait locus analysis of contextual fear conditioning in mice. Nat Gen 17:331-334.
Williams RW (1998) Neuroscience meets quantitative genetics: Using morphometric data to map genes that modulate CNS architecture. In: Morrison J, Hof P (eds) Short course in quantitative neuroanatomy. Society of Neuroscience, Washington DC, pp 66—78.
Williams RW (2000) Mapping genes that modulate mouse brain development: a quantitative genetic approach. In: Mouse brain development. (Goffinet A, Rakic P, eds), pp 21–49. Berlin: Springer.
Williams RW, Strom RC, Goldowitz D (1998a) Natural variation in neuron number in mice is linked to a major quantitative trait locus on Chr 11. J Neurosci 18:138–146.
Williams RW, Rakic P (1988) Three-dimensional counting: an accurate and direct method to estimate numbers of cells in sectioned material. J Comp Neurol 278:344–352, and 281:355.
Williams RW, Airey DC, Kulkarni A, Zhou G, Lu L (2000) Genetic dissection of the olfactory bulb of mice: QTLs on chromosomes 4, 6, 11, and 17 modulate bulb size. Behavior Genetics, in press.
Wimer CC, Wimer RE (1971) Some behavioral differences associated with relative size of hippocampus in the mouse. J Comp Physiol Psychol 76:57–65.
Wimer CC, Wimer RE, Wimer JS (1983) An association between granule cell density in the dentate gyrus and two-way avoidance conditioning in the house mouse. Behav Neurosci 97:844–855.
Wimer RE, Wimer CC (1982) A biometrical–genetic analysis of granule cell number in the area dentata of house mice. Dev Brain Res 2:129–140.
Wimer RE, Wimer CC, Vaughn JE, Barber RP, Balvanz BA, Chernow CR (1976) The genetic organization of neuron number in Ammon’s horns of house mice. Brain Res 118:219–243.
Wimer RE, Wimer CC, Vaughn JE, Barber RP, Balvanz BA, Chernow CR (1978) The genetic organization of neuron number in the granule cell layer of the area dentata in house mice. Brain Res 157:105–122.
Wimer RE, Wimer C (1985) Three sex dimorphisms in the granule cell layer of the hippocampus in house mice. Brain Res 328:105–109.
Wimer CC, Wimer RE (1989) On the sources of strain and sex differences in granule cell number in the dentate area of house mice. Devel Brain Res 48:167–176.
Wright S (1978) Evolution and the genetics of populations, Vol 4. Variability within and among natural populations. Chicago: University of Chicago.
Zetterstrom RH, Lindqvist E, Urquiza AM, Tomac A, Eriksson U, Perlmann T, Olson L (1999) Role of retinoids in the CNS: differential expression of retinoid binding proteins and receptors and evidence for presence of retinoic acid. Eur J Neurosci 11:407–416.
Zhou G, Williams RW (1999)
Eye1 and Eye2: Gene loci that modulate eye size, lens
weight, and retinal area in mouse. Invest Ophthalmol Vis Sci 40:817–825
Since 12 March 2000
Revised 20 Feb 2001