Note to the Reader This is a revised edition of a paper published in The Journal of Neuroscience in 1991. Several figures, and new data on growth cones in the optic chiasm, have been added. Text additions are in brackets [...].
Enlarging images. Thumbnail versions of all figures are embedded in the paper. Full-size images—usually under 300K—will download into a new window when you select the thumbnails. Drag the new window to the side of the text window. In some cases, high-resolution images—usually under 600K—that match the quality of the original micrographs can be downloaded by selecting the text at the bottom the corresponding figure legend.
Recommended fonts. In your browser's preferences menu, set Palatino 12 pt for text (variable width font), and Courier 10 pt for figure legends (fixed width font).
Revised HTML edition <http://www.nervenet.org/papers/GC91.html> copyright © 1998 by Robert W. Williams
The Journal of Neuroscience 11:1081–1094 (1991)
Abstract Ultrastructural criteria of
growth cones The early stage of
axon ingrowth Shapes of growth
cones The distribution of growth cones was studied in the optic nerve of
monkeys during the first half of prenatal development using quantitative
electron microscopic methods. Our aim was to test the hypothesis that
ganglion cell growth cones extend predominantly along the surfaces of the
nerve, just beneath the pia mater.
Growth Cone Distribution Patterns in the Optic Nerve of Fetal Monkeys:
Implications for Mechanisms of Axon Guidance
Robert W. Williams,
Michael Borodkin, and Pasko Rakic
Section of Neuroanatomy, Yale University School of Medicine, New Haven,
Connecticut USA 06510
Contents
Introduction
Materials and Methods
Quantification of growth cone
number by analysis of serial sections
A quantitative test of
growth cone criteria
The second stage of nerve
development
Growth cones in all
regions of the nerve
Left-right asymmetries
Growth cone traffic
patterns in the nerve
Spatial gradients of
growth cones
An argument on
substrate guidance
Differences among
vertebrate classes
Abstract
A complete census of growth cones in cross sections of the nerve
during the early phase of axon ingrowth—from embryonic day 39 (E39) to
E41—demonstrates that growth cones are scattered within the majority of
fascicles, even those located far from the surface of the nerve. By E45,
growth cones are concentrated around the nasal, dorsal, and ventral edge
of the optic nerve. They are less concentrated in the core and around the
temporal edge. However, even as late as E49, virtually all fascicles in
the nerve, whether deep or superficial, contain growth cones. Growth cones
are dispersed within single fascicles and are often located far from glial
processes. Thus, the newest fibers penetrate deep parts of the pathway and
push through centers of densely packed bundles of older axons. This
finding is consistent with the vagrant paths of growing axons reported in
previous work on embryonic monkey optic nerve (Williams and Rakic,
1985).
Our data challenge the hypotheses that growth cones extend
selectively along the basal lamina, the pia mater, or glial end feet.
Gradients found at later stages of development in the nerve are not due to
a particular affinity of growth cones for non-neuronal substrata. The
pattern we observed is much more likely to result from
central-to-peripheral gradients in ganglion cell generation and possible
associations between growth cones originating from the same regions of the
retina.
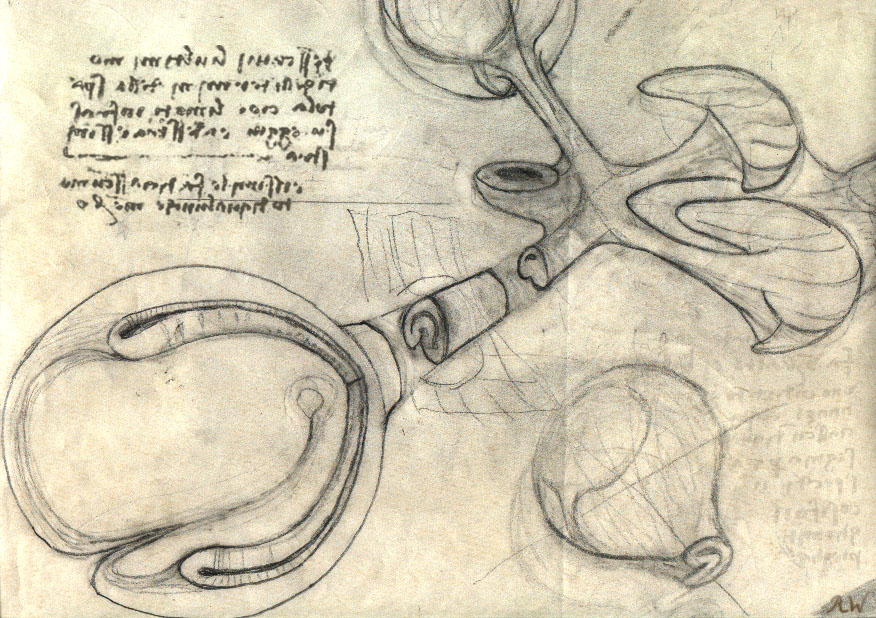
Sketch of the embryonic retina, optic stalk, optic chiasm and tract, and
the dorsal lateral geniculate nucleus of a typical mammal at an early
stage when axons are just beginning to invade the optic stalk. The
retina (lower left) has two walls—the outer pigment epithelium and the
inner neural retina. The choroid fissure splits the ventral half of the
retina and continues as a deep groove on the ventral side of the optic
stalk. Growth cones of ganglion cells (not shown) extend across the
inner surface of the retina and grow toward the root of the fissure (the
future optic nerve head) and into the ventral part of the optic stalk
(see oblique sketch at bottom right). Illustration by RW adapted from
the undiscovered Codex.
Introduction
A century of work has shown that axons that pioneer the pathway from
retina to brain extend along the surface of the optic nerve (Keibel, 1889;
Robinson, 1896; Froriep, 1906; Seefelder, 1910). Recent studies in several
species have extended this work and have shown that growth cones of
retinal axons are often found just beneath the pia and basal lamina, near
or next to glial end feet (Sapiro et al., 1980; Rager, 1980a,b, 1983;
Krayanek and Goldberg, 1981; Easter et al., 1984; Silver and Rutishauser,
1984), This pattern of peripheral growth appears to be common in several
systems (Singer et al., 1979; Nordlander and Singer, 1982; Silver et al.,
1982).
The generality of this finding has been called into question in
recent electron microscopic studies of the optic nerve of embryonic
mammals (Walsh et al., 1985; Williams and Rakic,
1985; Williams et al.,
1986). While following single axons and growth cones through serial
sections of an optic nerve of an embryonic day 39 (E39) monkey embryo, we
noted that growth cones were surprisingly widely distributed (Williams and
Rakic, 1985). However, the issue of precisely when and where growth cones
grow in this system has not yet been adequately addressed, let alone
resolved. The main problem has been the difficulty of studying the spatial
distribution of growth cones using quantitative methods. Until recently,
the fine structure of growth cones had not been well characterized, and
consequently, small parts of growth cones could not be reliably identified
among large populations of growing and dying fibers (Williams et al.,
1986). A related problem was that the shape of growth cones had not been
quantified, and consequently, estimates of key parameters such as the
frequency of branching, the length and diameter of growth cones, and the
distribution of lamellipodia and filopodia were at best imprecise.
In this study, we have overcome several of these problems. Recent
ultrastructural characterization of growth cones in monkey embryos
(Williams and Rakic, 1985, 1987) and advances made by other research
groups (Cima and Grant, 1982; Easter et al., 1984; Silver, 1984; Maggs and
Scholes, 1986; Bovolenta and Mason, 1987; Godement et al., 1987; Holt,
1989) provide a good foundation for a systematic study of the spatial
distribution of growth cones in the monkey’s optic nerve.
The location of growth cones is important: it has a direct bearing
on the normal substrata and conditions of axonal growth in the CNS. These
factors, in turn, have a direct bearing on molecular and morphogenetic
mechanisms that guide growth cones toward their targets and generate
topographic projections. In this paper, we focus on the depth distribution
of growth cones—in other words, on the distance separating growth cones
from the superficial margin of the optic nerve.
Materials and Methods
We have plotted the spatial distribution of growth cones of retinal
ganglion cells in ultrathin transverse sections of the optic nerve of
monkey embryos. One advantage of this approach is that, in the transverse
plane, a population of up to 2.8 million fibers can be sampled in a single
thin section (Rakic and Riley, 1983). Furthermore, because fibers are cut
across their long axes, membranes are well stained and distinct. As a
result, axons and growth cones stand out in sharp contrast from their
neighbors, and it is possible to categorize, count, and measure growth
cones easily. This is not true of oblique and longitudinal sections.
Another key advantage to this approach is that it is possible to measure
the distance between growth cones and the pial and fascicular surfaces in
the transverse plane. Work on the nerve fiber layer of the retina and on
the optic chiasm and tract is currently in progress and is not covered in
this paper.
Much of our analysis is based on estimates of the density and
percentage of growth cone profiles within single fascicles of retinal
ganglion cell axons. Fascicles are defined in single transverse sections
as bundles of axons and growth cones surrounded by glint processes. While
fascicles have provided us with a convenient way to subdivide the nerve
for analysis, it is well known that these structures branch and merge
extensively in the mammalian optic nerve (Silver, 1984; Williams and Rakic,
1984).
As mentioned above, one difficulty of an ultrastructural approach is
recognizing small parts of growth cones. For this reason, we have relied
on reconstructions from serial thin sections to help us determine the
shape, size, and ultrastructure of growth cones at each of 4 ages: E39,
E49, E59, and E69. Serially sectioned material in the present study was
processed to help us in developing criteria for recognizing and counting
growth cones in the monkey, but the present paper does not specifically
deal with the 3-dimensional shape of growth cones.
Tissue. Fetal monkeys of known gestational age were removed by cesarean section. Gestation in this species is normally 165 days. Tissue from the retina, optic nerve, chiasm, and optic tract of 16 fetuses ranging in age from E34 to E95 was examined. Detailed quantitative analysis in the present study was limited to a set of 6 animals (E39, E41, E45, E49, E59, and E69) with the best fixation, abundant growth cones, and the most appropriate plane of section through the optic nerve. All fetuses were perfused with mixtures of glutaraldehyde and paraformaldehyde. After dissection, tissue was osmicated, embedded in plastic, sectioned at 0.07–0.10 µm and stained. Single thin sections, serial thin sections (series of between 500 and 1000 sections), and sequential thin sections (single thin sections separated by series of 20–50 1-µm-thick semithin sections) were mounted on coated slot grids and examined with a transmission electron microscope. Low- to medium-magnification micrographs were taken and were used to make large survey montages at 2000–3000x. Higher-power micrographs and serial micrographs were printed at 10,000–20,000x and used for detailed analysis and counting. Magnification was calibrated to within ±5% using a carbon replica grid. Typical electron micrographs of axons, growth cones, and glial processes in the optic nerve are marked in some figures (see Figs. 1, 5, 6). To determine accurately the distribution of growth cones, we had to be able to categorize all structures in such micrographs. This was done by reconstructing growth cones in the optic nerve at E39, E49, E59, and E69 (Williams and Rakic, 1984; R. W. Williams and P. Rakic, unpublished observations). Growth cones in the nerve are approximately 30–40 µm long. However, some are as short as 15 µm, and others extend more than 50 µm.
A Criterion for Growth Cones. All growth cones we have
reconstructed in the optic nerve are characterized by extensive membrane
sheets, 0.05–0.3 µm thick, that are between 3 and 10 µm long and nearly as
wide. These sheets, or lamellipodia, contain a mesh of actin filaments and
usually a small number of clear vesicles (Bunge, 1973; Cheng and Reese,
1985; Williams et al.,
1986). In contrast to glial processes, lamellipodia do not contain
ribosomes or intermediate filaments. It was therefore straightforward to
determine whether a process originated from a ganglion cell or from a
glial cell.
The distinction between axons and lamellipodia is also
straightforward because lamellipodia rarely contain microtubules. In
contrast, all axons have at least 3 or 4 microtubules in any single
transverse section. Because lamellipodia have such a distinct
ultrastructure and because they are large and easy to recognize, we chose
these structures as our criterion for growth cones. In the fetal monkey,
lamellipodia are found in all parts of the pathway, including the optic
chiasm and optic tract. For these reasons, we marked and analyzed only
growth cone profiles that in single sections had 1 or more lamellipodia.
This simple criterion has the important advantage of giving us a
pure sample of growth cones; it excludes virtually all axons and all glial
processes. However, from a quantitative standpoint there are some inherent
difficulties with this criterion. One obvious problem is that many growth
cones are branched and have 2 or more lamellipodia. A remarkably growth
cone that we recently reconstructed had 4 lamellipodia in 3 neighboring
fascicles. Branching will naturally cause an overestimate of the local
density of growth cones. We have been able to determine and compensate for
this error by analyzing the shapes of fully reconstructed growth cones. At
E39, the overestimate caused by branching averages 18.4 ± 2.7% per
section. (For this analysis, we studied 17 evenly spaced sections through
a series of 500 sections.) Thus, in any single section, the number of
lamellipodia that are counted is approximately 18% greater than the number
of growth cones. This may seem a surprisingly small error considering that
more than half of all growth cones are branched, but the explanation is
simple: branches are generally restricted to the leading 10 µm of the
growth cone, and branches are often merely 2–5 µm long.
A second problem is that lamellipodia may sprout out from the sides
and even the trailing end of the growth cone. In order to determine the
bias introduced by using lamellipodia as our criterion, we needed to
determine their spatial distribution along the entire length of a set of
growth cones. Thirty-one fully and partially reconstructed growth cones
from the E39 optic nerve were used for this purpose. More than 75% of the
lamellipodia were located within 15 µm of the tip. In contrast, fewer than
10% of the lamellipodia were located farther than 50 µm from the tip. It
follows that by restricting our analysis to lamellipodia we have
effectively focused attention on the leading 20–30 µm of the growth
cone—the portion that is of greatest interest with respect to
surface-mediated interactions involved in the growth and guidance of nerve
fibers.
The third problem is that not all transverse sections through growth
cones will include lamellipodia. Again, by analyzing reconstructed growth
cones we determined that a single transverse section has roughly a 75%
probability of cutting through one or more of the lamellipodia of a
typical growth cone. The underestimate caused by lamellipodia-free
segments therefore amounts to about 25%. This underestimate nicely
counterbalances the 18% overestimate caused by branching, and for this
reason the density of growth cone profiles calculated from single
transverse sections and expressed per unit area is only slightly less than
the true value. We have in fact been able to confirm this by determining
the absolute total number of growth cones in an E39 nerve by counting the
number of fibers close to the eye and close to the chiasm and then
comparing this number with densities estimated using our criteria. The
agreement is striking (Fig. 4).
Results
About 2.5 million retinal ganglion cells are generated between E34 and E80 in each eye of the rhesus macaque fetus (LaVail et al., 1991). These axons grow into the optic nerve at an average rate of 50,000 per day—roughly 30 per minute (Rakic and Riley, 1983). It follows that growth cones should be present in large numbers in the nerve throughout most of this 1.5-month period. We found that there are, in fact, many growth cones along the entire length of optic nerve as early as E39 (see Figs. 1, 4). After E70, the rate of ganglion cell proliferation declines rapidly, and as a consequence, there are only a few growth cones in single sections of the optic nerve, diluted among a population of more than 2 million axons (Rakic and Riley, 1983). The analysis in this paper is restricted to the optic nerve. At two age (E39 and E45) we have studied sections at different levels of the nerve, from just behind the eye to just in front of the chiasm.
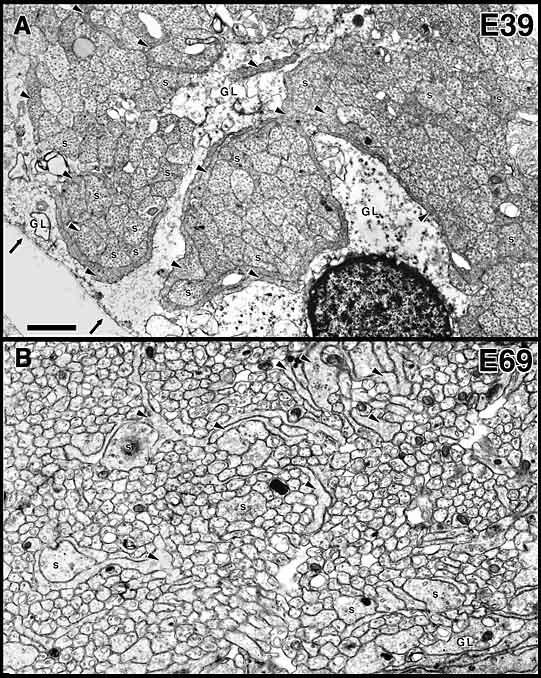
Figure 1. Growth cones in the optic nerve at E39 and E69, the early
and late endpoints of this study. A, a field from the ventral
portion of the optic stalk at E39 with an area of 75 µm2.
The long, dark, sinuous processes indicated with arrowheads are
growth cones. Using criteria reviewed in Materials and Methods, there are
13–15 growth cone profiles in this micrograph (13 are marked). However,
based on serial-section analysis of this tissue (Williams and Rakic,
1984), we know that many of the fibers (labeled s for growth cone
shanks) are cut very near to their tips. The lightly stained regions
labeled GL are glial cell processes. The basal lamina, the outer
surface of the optic nerve, is visible as a faint gray line running along
the edge of the glial cells and is indicated by 2 small arrows.
B, a field from the extreme medial/nasal periphery at E69, The
field contains 8–10 growth cone profiles (arrowheads) and several
growth cone shanks (s). The edge of the nerve is just visible in
the lower right corner. Scale bar is 1 µm, and applies to both
images. Click on the image to obtain a larger 120 KB image or download a
high-resolution
900 KB image for data analysis.
The Early Stage of Axon Ingrowth
At E39 and E41, the optic nerve (or the optic stalk at this stage) is roughly 100 µm in diameter and contains a group of 50–150 interweaving fascicles composed entirely of retinal ganglion cell axons (Figs. 1A, 2B). Between E38 and E42, these fascicles appear as distinct bundles in single section, but reconstructions reveal that fascicles interweave and form a plexus running along the ventral half of the stalk into the optic chiasm (Williams and Rakic, 1985). These fascicles cover 6–12% of the cross-sectional area of the nerve and collectively contain about 10,000 fibers at a point close to the eye but only 3000 fibers at a point close to the chiasm (see Fig. 4). At this early stage, the axons are located only in the ventral half of the nerve, the half that is continuous with the retina. Growth cones are scattered widely across almost the entire ventral half of the nerve (Figs. 2, 3A,B). Even in a single section only 0.1 µm thick, growth cones—or more precisely, the cross-sectional profiles of growth cones—are found in a substantial majority of fascicles, even those located more than 30–40 µm from the pial margin (Figs. 2B, 3A). We quantified sections at several levels along the E39 nerve and found that the scattered pattern of growth cones illustrated in Figure 2 is conserved along the entire length of the nerve. The plot illustrated in Figure 2B demonstrates that fascicles containing relatively high densities of growth cones are often located deep in the nerve. Note that many of these deeper fascicles are quite small, whereas the more superficial fascicles are large. The opposite pattern is seen later in development, when small and typically younger fascicles are located closer to the edge (see Fig. 9A).
Figure 2. Distribution of growth cones and fascicles at E39. A,
the positions of single growth cone profiles within a 0.1-µm-thick
transverse section at a midorbital level. Each growth cone profile is
represented by a short line segment that is somewhat longer than
the average growth cone profile. As shown in B, fascicles are
initially concentrated in the ventral peripheral part of the stalk. Thus,
the apparent gradient of growth cones in A reflects fascicular
distribution. Fascicles that contain many growth cones (green and blue
areas) are widely distributed at this stage and are quite common deep
in the stalk. A quantitative analysis of the position of fascicles plotted
against concentration of growth cones per fascicle is shown in Figure 3.
This figure can be usefully compared to Figure 3 of Rager (1980a).
To uncover subtle gradients in the distribution of growth cones, we pooled data on the density of growth cones per fascicle from 5 sections spaced over a 500-µm distance along the nerve. The plot (Fig. 3A) does not reveal any marked trend or gradient. Fascicles with high and low percentages of growth cones are distributed widely. However, when we compared the distance from the edge of the nerve to fascicles that contain growth cones or to fascicles that do not contain growth cones, we were able to reveal a small but distinct difference (Fig. 3B). We found that there are relatively more fascicles without growth cones deep in the nerve than there are close to the edge. This small bias or gradient in the distribution of growth cones becomes much more pronounced by E45.
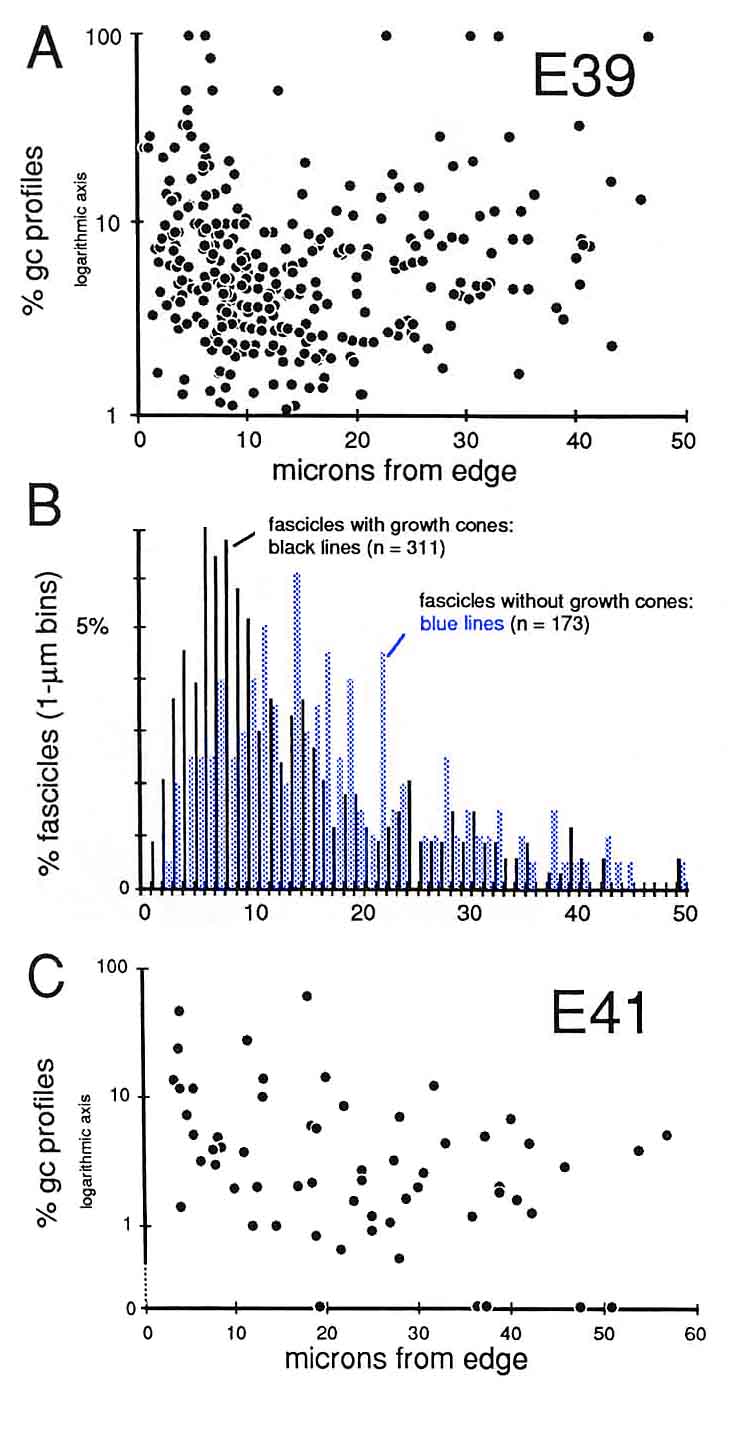
Figure 3. Quantitative analysis of growth cone distribution at E39
and E41. A, scattergram of the percentage of growth cone profiles
per fascicle with respect to the total fascicular fiber number. Each
point represents an analysis of a single fascicle of fibers. The
analysis in A is based on 6 montages of the optic nerve made at
different levels between eye and chiasm (see Fig. 4). Note that the
percentages on the y-axis are plotted using a logarithmic scale. A large
number of fascicles (173 of 484) that did not contain growth cones have
been excluded from this logarithmic plot. B, a quantitative
comparison at E39 of the positions of fascicles that do not contain growth
cones (the blue or shaded bars of the histogram) and fascicles that
do contain growth cones (solid bars). We measured the shortest
distance from the center of the fascicle to the edge of the nerve. This
analysis uncovers a slight peripheral bias of growth cones even at E39.
C, scattergram of the density of growth cone profiles at E41 in a
single transverse midorbital section of the optic nerve. Methods of
presentation are the same as in A, except that in this
semilogarithmic plot we have included 6 fascicles that did not contain
growth cone profiles along the x-axis.
Quantitative Test of Growth Cone Criteria. A quantitative analysis of the gradient in fiber number along the optic nerve allowed us to test the accuracy of the criterion we were using to count growth cones (Fig. 4). At the origin of the optic stalk at E39, there was a total of 10,000 ± 500 fibers, Just before the optic chiasm, there was a total of 3000 ± 250 fibers, The rate of decline in fiber number is almost a linear function of distance—roughly 10 fibers per micron (Fig. 4). Thus, a 1-µm transverse slab of the nerve should contain, on average, 10 growth cone tips. Because ganglion cell growth cones are typically about 30 µm long (Bovolenta and Mason, 1987; Williams and Rakic, 1987; Holt, 1989), there should be roughly 300 transected growth cones in a 1-µm-thick section of the stalk, and in a 0.1-µm-thick ultrathin section, there should be 291 transected growth cones (300 minus 9). Our direct counts of growth cone profiles (Fig. 4, right ordinate) are quite close to this estimate based on the gradient in fiber populations. The percentage of growth cone profiles at different points along a single nerve at E39 varies from 3.7% at a distance of 250 µm behind the eye, to 5.1% more proximally along the nerve, and to 2.6% close to the optic chiasm. These longitudinal, distal-proximal differences may reflect sampling noise, subtle variation in the kinetics of ganglion cell production, or differences in the mean velocity of axon elongation (Maggs and Scholes, 1986; Davies, 1989).
Figure 4. Gradient in the fiber population along a single optic
nerve at E39 censused completely at 8 sites (transverse cross sections)
between the eye and the chiasm. The line through the black
circles demonstrates the steady decline in total fiber population from
just behind the eye at the lamina cribrosa to within approximately 50 µm
of the chiasm. The red squares and the right ordinate show
that the number of growth cone profiles in the montages varied from 100 to
300 per cross section. From a plot like this it is possible to estimate
true growth cone density in the nerve.
It is still open to question whether growth cones at this early stage express selective affinity for widely distributed glial cell processes. It is certainly the case that growth cones at E39 tend to be distributed around the edge of individual fascicles (Fig. lA). On the one hand, this may be viewed as support for the notion of selective affinity between growth cones and glial cell processes, but on the other hand, this finding may result as much from reduced mechanical resistance to growth at the fiber-glial interface as from any selective affinity for glial processes. The first growth cones to pioneer any region of the stalk grow into a system of neuroepithelial-glial tunnels (Silver, 1984; Williams et al., 1986) and invariably contact the walls of these tunnels. But again, we do not know whether this position is due to simple mechanical factors or to selective affinity. In our experience, even the very first growth cones never contact the basal lamina (cf. Williams et al., 1986).
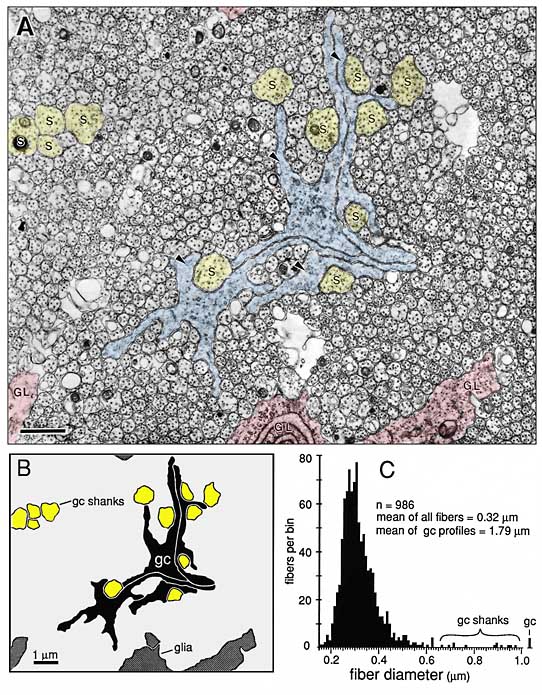
Figure 5. A, a cluster of typical growth cones in the center of the
optic nerve at E59. The growth cone cross-sections have been tinted blue.
Note that these 4 large centrally-located growth cones are growing along a
group of 8 growth cone shanks that are tinted yellow. The position of the
field reproduced in A is shown in Figure 11.B, a
half-scale drawing of A, in which the 4 major cellular components
are labeled: axons, very light gray; glia, dark gray; growth
cones, black; growth cone shanks, yellow. This cohort of
growth cones is in the process of extending through the center of the
nerve without the benefit of any contact with glial cells. C, a
histogram of fiber diameter in the field reproduced in A.
Calibration bars are 1 µm.
775 KB high-resolution image of entire figure.
The Second Stage of Nerve Development
Between E39 and E45, the optic nerve is transformed rapidly by the addition of thousands of fibers. The lumen of the stalk is obliterated, and the dorsal half of the nerve becomes filled with fibers. During this period, fiber number doubles approximately every 24 hr, and by E45 the nerve contains 380,000 ± 10,000 fibers and has a cross-sectional area of about 40,000 µm2. Of this area, 70–75% is occupied by fibers; the remainder is occupied by glial cells and a few blood vessels.
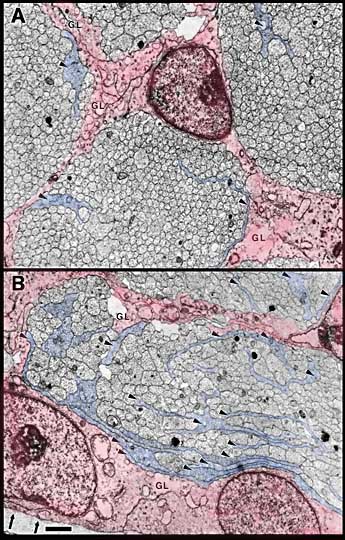
Figure 6. Fascicles and growth cones at E45. A, a group of
fascicles located approximately 16 µm from the edge of the nerve. Growth
cones are tinted blue; glial cells and their processes are tinted red. The
fascicles in this region have growth cone densities between 7 and 12 per
100 µm2. B, a fascicle located at the
medial (nasal) perimeter of the nerve in which growth cone density reaches
a high of 46 per 100 µm2. The center of this
fascicle is approximately 5 µm from the edge. Approximately 250
micrographs such as these were analyzed to provide data for the isodensity
contour diagram in Figure 7. There are no notable differences in
the ultrastructure of growth cones in different parts of the optic nerve.
High-resolution image
Widespread Distribution of Growth Cones. Between E45 and E59, single cross sections of the nerve typically cut through a total of between 1000 and 6000 growth cones. Growth cones are found within nearly all parts of the nerve (Figs. 6, 7) and are found within virtually every fascicle at E45 and E49. For instance, at E45, 265 of 268 fascicles that we quantified in the left and right nerves contained growth cone profiles. This finding may initially seem surprising, because at E39, 173 of 484 fascicles contained no growth cone profiles. This difference is explained by the finding that each fascicle at E45 is 10 times larger than at E39/E41. At E45, fascicles typically contained an average of 1000 axons and 10–20 growth cone profiles. As late as E49, all parts of the optic nerve, even the deepest, are penetrated by new fibers.
Figure 7. Growth cone distribution at E45. The density of growth
cone profiles was measured in a subset of 350 fascicles from which the
contours were generated. Densities are typically higher close to the
surface of the nerve and are particularly high around the medial
perimeter. Densities are lower in the center and on the lateral side of
the nerve.
Growth cones are also scattered widely within individual fascicles and are as common on the inside next to other growth cones and axons as they are around the outside next to glial cell processes. A clear example of a group of growth cones in the center of a fascicle is illustrated in Figure 5. Here, a group of 4 growth cone profiles is shown close to the center of a large central fascicle, which itself is located at the center of the nerve. None of the 4 growth cones contact a glial cell process at this level.
Variability. There were some quantitative differences between right and left nerves at E45 that provide insight into the range of variation that can be found within a single case. Midorbital sections through the left nerve contained 370,000 fibers and 6200 growth cone profiles whereas comparable sections through the right nerve (Fig. 6) contained 380,000 fibers and 4100 growth cone profiles. The percentage of growth cones on the left was appreciably higher than on the right (1.8% vs. 1.1%). A similar 2-fold difference was also seen along the course of a single nerve taken from the E39 case (Fig. 4). Thus, as much as a 2-fold difference may arise from small differences in timing or sampling.
Figure 8. Radial gradient in growth cone distribution at E45. A, scattergram of the density of growth cones in 170 fascicles from a single cross section. The shortest distance from the center of each fascicle to the periphery of the nerve is plotted on the x-axis. Note the wide range of values of growth cone densities around the periphery—from 10 to 45 growth cone profiles per 100 µm2. A line has been drawn by eye through the data set to provide a simple synopsis of the gradient. B, a histogram of growth cone density in the same nerve. Here, we have divided the nerve into 10 concentric regions, each with the same area. The positions of the inner and outer borders of these 10 regions are marked on the x-axis. For instance, in the annulus with outer and inner edges at 13.0 and 18.0 µm, the density of growth cone profiles averages about 11 per 100 µm2. Because each bar represents the same size territory, this histogram can be used to assess relative and absolute numbers of growth cones in each zone. Roughly 50% of growth cones are located more than 15 µm from the pia mater.
Gradients in the Positions of Growth Cones
At E45 and as late as E70, there are pronounced gradients in growth cone density. Densities are typically low deep in the nerve and high around the perimeter. For instance, at E45 the density of growth cone profiles within individual fascicles at the margin of the nerve varies from 10 to 100 per 100 µm2 with an average of about 25 per 100 µm2, whereas in the center of the nerve, the density varies between 0 and 20 per 100 µm2, with an average of about 10 per 100 µm2 (Fig. 7). At E49, the density gradient is somewhat greater, with a 4-fold difference between center and periphery (Figs. 8A, 11).
Figure 9. Radial gradient in growth cone distribution at E49. Conventions are as in Figure 8. In the scattergram of A, we have added data on the percentage of growth cones in each fascicle (squares) and also added a broken line to show the curve of growth cone density at E45. Note that when growth cone profiles are plotted as a percentage of all fibers, the gradient appears much steeper. The reason for this difference is made clear in Figure 10. The pattern of distribution of growth cones at E45 and E49 is practically the same. However, there are large quantitative differences, as indicated in A. Asterisk marks bar for which an error term could not be computed.
While growth cone density is often high around the perimeter of the
nerve, growth cones rarely if ever push through the glial sheath that
surrounds the nerve. Consequently, growth cones in the monkey do not
contact the basal lamina at any stage of development. This is true along
the entire optic nerve, as well as in the retina, chiasm, and optic tract
(Williams and Rakic, 1984).
It is important to point out that the density of growth cones is
almost constant within a large part of nerve core (Figs. 8, 9). At
both E45 and E49, the mean density and percentage of growth cones do not
vary appreciably between 25 µm from the edge to the center of the nerve.
One can divide the nerve into two relatively discrete zones: a superficial
rind about 15–20 µm thick that contains a high density of growth cones,
and a large central region that contains a low and fairly even
distribution of growth cones.
When the nerve is divided in this way, it can be shown that each of
these two regions contains roughly the same total number of growth cones (Figs.
8B, 9B). At both E45 and E49, roughly half of all growth cones are
located in a superficial annulus 15–20 µm wide, whereas the other half are
located in the central zone.
Figure 10. Global attributes of the optic nerve at E49. A,
drawing of the fascicular structure of the nerve. Note that the majority
of fascicles in the center of the nerve are large, whereas fascicles near
the perimeter are small. Small fascicles tend to contain more growth cones
and more large axons. Large fascicles contain a population of older and
smaller axons.
B, plot of the percentage of different growth cone (gc) and
fiber categories per fascicle, based on the analysis of the same fascicles
presented in Figure 9. Growth cone profiles are characterized by
lamellipodia. Very large fibers, typically with diameters above 0.8 µm,
were classified as growth cone shanks. These often have the
ultrastructural characteristics of growth cones, but lack lamellipodia.
Large axons have diameters between 0.4 and 0.8 µm. Large axons are simply
the parts of fibers within 100–500 µm of the growth cone tip. Note that
the gradient differs for each category and is steepest for growth cones
and least steep for large axons.
C, plot of small axons. This plot is almost the inverse of those
presented in band Figure 9A. Small axons are old axons. They predominate
in the central and temporal parts of the optic nerve and are relatively
uncommon around the perimeter of the nerve at this age.
The superficial-to-deep difference appears to be more extreme when growth cone percentages per fascicle are plotted instead of absolute densities (Figs. 9A, squares). For instance, at E49 the percentage of growth cone profiles averages about 0.5% in central fascicles and is as high as 15% in superficial fascicles, a 30-fold difference. In comparison, the absolute density difference is only 4–5-fold. The explanation is that the average size of fibers in superficial and deep fascicles differs greatly. Central fascicles typically contain many more small fibers than do superficial fascicles (Fig. 10B, C). This in turn leads to an increase in axon packing density and a sharp decrease in the percentage of growth cone profiles in the total fiber population in these central fascicles. The reason there are more small axons in central fascicles is related to axon age: small axons are typically older; they have been in the nerve for a longer time, and their growth cones have progressed farther into the brain. In contrast, large axons are relatively young axons or even the trailing part, the shank, of the growth cone (Fig. 5; Williams and Rakic, 1985).
A Nasal-to-Temporal Gradient. There is a second and equally important gradient in growth cone distribution. Many more growth cones are located in the nasal half of the nerve than in the temporal half (Figs. 7, 11). At E45, the difference in growth cone density within the midorbital nerve is about 4–5-fold between the nasal and temporal edge. At E59 and E69, the asymmetry is even more marked. At this late stage, the temporal perimeter, like the temporal-central nerve, contains almost no growth cones at all.
Figure 11. A, plot of the distribution of all growth cone (GC)
profiles in a single section of the optic nerve at E59. Each line
represents the approximate location of a growth cone. Where lines would
have overlapped due to tight clustering of growth cones, they have been
separated slightly. Thus, local clustering of growth cones is actually
more pronounced than is apparent in this illustration, particularly in the
ventral quadrant.
B, histogram of the same population of growth cones, illustrating
the superficial-to-deep gradient at this age. This histogram is most
comparable to the scattergrams in Figures 8A and 9A.
Growth cone density varies around the entire circumference of the
nerve. Both the dorsal and ventral sides contain higher average densities
than the temporal side but lower average densities than the nasal side.
During the last phase of axon addition, from E59 to E80, the
absolute density of growth cones decreases markedly. For instance, at E69
the peak density of growth cone profiles at the perimeter of the nerve is
only 10 per 100 µm2. However, most of the
superficial part of the nerve (85% of the perimeter) contains only low
densities of between 0.1 and 1.0 growth cone profiles per 100 µm2.
Central densities are also very low, in the range of 0.0–0.5 growth cone
profiles per 100 µm2.
[Growth Cone Gradient in the Optic Chiasm. On embryonic day E39 the first few thousand axons cross midline and begin to form an optic chiasm. At this stage, growth cones are found in all fascicles. Most fascicles are located 5–20 µm from the pial surface and do not yet form the dense aggregate of fibers typical of the more mature chiasm. By E45 a definitive chiasm has formed. Fasicles can no longer be recognized. Already at this age close to 300,000 fibers from each nerve cross midline in a dense tract criss-crossed by surprisingly few glial processes. While growth cones are distributed throughout the chiasm, there is a distinct deep-to-superficial gradient (Fig. 12). In contrast to the nerve, whorl-like aggregates of growth cones are common in the chiasm at this age. At E54 and E58 the deep-to-superficial gradient is even more marked, although growth cones are still common up to 100 µm from the pial surface.]
Figure 12.Distribution of growth cones at the midline of the optic
chiasm at E45. The number of growth cones in each sample area is shown.
Color and shading provides a better impression of gradients. Total axon
number at the chiasm is 559,000 and the cross-sectional area of the chiasm
is 82,500 µm2. This figure was not included in
The Journal of Neuroscience paper. Data from Williams and Rakic, 1987.
![]()
Discussion
Synopsis. We have analyzed the spatial distribution of unambiguously identified growth cones in cross sections cut through the entire optic nerve of fetal monkeys. Within these cross sections, as many as 6000 growth cones are widely scattered. Growth cones are present in virtually all regions—around the entire perimeter and in its center. However, at later stages of development, the temporal edge and the core of the nerve are sparsely populated by growth cones, whereas the nasal edge is densely populated.
Shapes of Growth Cones in Relation to Their Density
The geometry of growth cones can vary with position and age (Tosney and
Landmesser, 1985; Bovolenta and Mason, 1987; Nordlander, 1987; Holt,
1989). This shape variation could generate false gradients in growth cone
density. In preliminary work and work still in progress, we have found
that the form of growth cones in the monkey varies comparatively little
with age or position within the nerve (Williams and Rakic, 1987). For
instance, the shape and ultrastructure of large sets of growth cones in
the center and periphery of the nerve and on the nasal and temporal sides
of the nerve cannot be distinguished either qualitatively or
quantitatively. Furthermore, we have not been able to detect any
quantitative morphological differences between growth cones close to the
retina and those close to the optic chiasm, Finally, direct comparisons of
serially sectioned tissue in the optic nerve also demonstrate rather
modest age variation in growth cone morphology (Williams and Rakic, 1984).
Nonetheless, it should be obvious from the foregoing remarks that
estimates of growth cone distribution should be interpreted cautiously. As
a rule, relative comparisons of growth cone density within single sections
can be made with few reservations. If there are twice as many growth cone
profiles 10 µm from the pial margin as compared to 50 µm from the margin,
and if the profiles have the same shape and size, then this result
reflects almost precisely a 2-fold difference in the absolute number of
growth cones.
An additional factor to consider in this context is that there may
be substantial differences in the mean velocity of axonal growth (Agiro et
al., 1984; Maggs and Scholes, 1986; Davies, 1989). Consequently, equal
densities of growth cones in two regions of the nerve do not necessarily
signify that the same number of growth cones will traverse the two regions
in a given period of time. A 2-fold difference in mean velocity could give
rise to a 2-fold difference in the flow of growth cones. Because this
difference is invisible in static images, one must recognize the
possibility that there are velocity gradients along the pathway from the
retina to the target and from subpial fiber bundles to those located deep
in the pathway.
Growth Cone Spatial Gradients in Relation to Ganglion Cell Genesis
The spatiotemporal distribution of growth cones in the nerve can be
readily explained in terms of the sequence of ganglion cell production and
the retinotopic organization of the monkey’s optic nerve. A key finding is
that retinal ganglion cells are initially generated exclusively in the
central (foveal) part of the retina (LaVail et al., 1991). For this
reason, the first growth cones that enter the optic stalk circa E34/35
originate from central retina. The region of most intense production
gradually spreads outward toward the periphery, and after E50 the great
majority of ganglion cells are generated in the mid- and far-periphery of
the retina. Nonetheless, even at fairly late stages of development
(E45–55), ganglion cells are still being generated in small numbers in the
central retina (LaVail et al., 1991).
A second key finding is that the majority of axons originating from
foveal and perifoveal parts of the retina are confined to the temporal and
central-temporal parts of the optic nerve (Polyak, 1957; Naito, 1989).
This is a consequence of the fact that central retina is situated on the
lateral side of the optic disk. Although there is a great deal of
dispersion of fibers from any particular part of the retina (Naito, 1989),
it is also generally true that nasal fibers from the mid periphery of the
retina are found in the nasal sector of the nerve, dorsal fibers in the
dorsal sector, and ventral fibers in the ventral sector.
How are these features related to the position of growth cones in
the fetal optic nerve? After E45, the temporal and central parts of the
optic nerve contain fewer growth cones than do the nasal, dorsal, and
ventral sectors. The most plausible reason for this difference is that
temporal and central-temporal regions contain fibers from the older foveal
and perifoveal regions of the retina. In contrast, the nasal perimeter of
the nerve gets a heavy influx of fibers from the nasal periphery of the
retina, a zone of very active ganglion cell production from E45 through
E70. This probably accounts for the high concentration of growth cones in
the nasal half of the nerve. Axons from ganglion cells in the temporal
periphery—also a zone of active cell proliferation—do not grow into the
temporal quadrant of the nerve. Instead, they arch around the fovea and
grow into the dorsal and ventral quadrants of the nerve (Naito, 1989). We
cannot exclude the possibility that the small number of growth cones in
the central and temporal parts of the nerve are wandering fibers that
originate from the periphery of the retina. However, given the fact that
ganglion cells are generated in the central retina at least as late as
E55, it is more likely that the small number of growth cones in the core
of the nerve at E59 originate from the last-generated ganglion cells of
the central retina.
Figure 12. Retinotopy in the adult rhesus monkey optic nerve as determined by following small populations of WGA-HRP labeled retinogeniculate axons. The right side of each illustration is the nasal or medial region. The foveal region is at the intersection of the vertical and horizontal lines in the upper illustration of the retina. Foveal and perifoveal fibers initially occupy the lateral part of the nerve, but close to the chiasm these fibers are positioned centrally. This iIllustration is from the work of J. Naito (1989).
In summary, the distribution of growth cones in the nerve is
consistent with a simple model in which growth cones grow into
topographically harmonious parts of the nerve. However, as we have shown
previously by following single axons in the embryonic optic stalk
(Williams and Rakic, 1985), growth cones do not track tightly along
preexisting axons, nor do they even necessarily stay together within
single fascicles, Thus, if there are factors intrinsic to the nerve that
generate or preserve the rough topographic order, they would probably have
a comparatively broad distribution.
Locations of Growth Cones with Respect to Substrate Guidance
It has been accepted for a century that the newest retinal axons grow
along the surface of the optic pathway (Keibel, 1889; Robinson, 1896;
Froriep, 1906). This concept has received renewed interest due to
observations that ganglion cell growth cones may grow preferentially just
beneath the basal lamina and pia among the processes of glial cells (Bodick
and Levinthal, 1980; Easter et al., 1981, 1984; Krayanek and Goldberg,
1981; Silver and Sapiro, 1981; Rager, 1983; Fraser et al., 1984; Halfter
and Deiss, 1984; Silver and Rutishauser, 1984; McLoon, 1985; Maggs and
Scholes, 1986). The possibility of strong affinities between growth cones,
glial processes, and the basal lamina has catalyzed a search for
extracellular substrata and cell-surface molecules that direct or
encourage these growth cones toward their targets. Among the most
prominent, if not most promising, candidates are neural cell adhesion
molecules and the extracellular matrix components laminin and fibronectin—molecules
that have been found in the right place at roughly the right time in
amphibians, birds, and even some mammals (Fraser et al., 1984;
Schlosshauer et al., 1984; Silver and Rutishauser, 1984; Thanos et al.,
1984; McLoon et al., 1988). These results are interpreted in light of
probable mechanisms that guide axons toward their targets and that
generate retinotopic projections.
Our data do not support hypotheses that growth cones extend
selectively along the basal lamina, the pia mater, or glial end feet. The
nasal-to-temporal and the superficial-to-deep gradients found at later
stages of development in the nerve do not appear to be due to any
particularly affinity of growth cones for non-neuronal substrata. As
summarized above, the pattern we observed is much more likely to result
from the central-to-peripheral wave of ganglion cell generation.
Retinal ganglion cell growth cones appear to grow along many, if not
all, types of surfaces found in the CNS and even the PNS (So and Aguayo,
1985; Harris, 1986). Furthermore, retinal growth cones manage to grow
quite well even in vitro (e.g., Bonhoeffer and Huf, 1985). This
does not mean that growth cones are insensitive to differences in
substrata, natural or artificial. There are now compelling examples of
growth cones that show preferences to grow along distinct classes of axons
(Bastiani, 1985; Kapfhammer and Raper, 1987; Moorman and Hume, 1990). The
profound differences in the arrangements of fibers in the optic nerve,
chiasm, and tract in several vertebrate classes (Torrealba et al., 1982;
Maggs and Scholes, 1986; Guillery and Walsh, 1987; Udin and Fawcett, 1988)
strongly suggest that growing fibers also respond to changes in their
environment. Furthermore, fibers consistently terminate in particular
parts of the brain in patterns that are most readily explained by
differential chemoaffinities. However, it seems likely to us that growing
nerve fibers use a combination of substrate molecules and morphogenetic
cues to navigate. The guidance code could be partly redundant and could be
robust enough that single elements could be deleted without causing errors
of connection.
Differences Among Vertebrate Classes
The particular fiber architecture of the optic nerve depends primarily
on the behavior of growth cones early in development. For instance, in
cichlid fish, retinal ganglion cell growth cones definitely grow together
in a single compact bundle at the surface of the nerve (Maggs and Scholes,
1986). This characteristic ultimately gives rise to a mature nerve that is
ribbon shaped. One consequence of the peripheral affinity of growth cones
in goldfish is that fibers from different parts of the retina that grow
out of the eye at the same stage merge in the nerve. Here they form annuli
or bands of new fibers beneath the pia (Easter et al., 1981; Scholes,
1981; Bunt, 1982; Taylor, 1987). As a result, the optic pathway becomes
stratified—the oldest axons are located deepest; the youngest are located
more superficially. This organization is referred to as chronotopic.
The structure of the adult mammalian optic nerve differs in
important ways from the highly ordered chronotopic pattern characteristic
of fish. Retinal axons in the optic nerves of humans, monkeys, cats, and
several other mammalian species are arranged in a comparatively
disorderly, but still roughly retinotopic, pattern (Polyak, 1957; Hoyt and
Luis, 1962; Naito, 1986, 1989). This class difference may reflect the more
chaotic spatiotemporal pattern of ganglion cell genesis in mammals or the
greater density of growth cones traversing the pathway. Serial-section
analysis of single axons and growth cones has shown that this disorder is
present as early as E39 in the monkey and that the disorder is most likely
caused by the meandering paths taken by individual growth cones (Williams
and Rakic,
1985). However, it is clear that growth cones do not wander too far
from their initial axonal neighbors, because a limited degree of
retinotopy is maintained throughout the nerve (Naito, 1989). Evidently,
the particular retinal site from which a fiber originates is somewhat more
important in mammals than the time at which the fiber and cell body are
generated.
The notable differences in the architecture of the optic nerve,
particularly between teleosts and mammals, suggest that there may be
equally revealing differences in the behavior and substrate affinities of
retinal growth cones in this particular part of the pathway. A simple
difference in the expression of substrate preferences of homologous
neurons in different vertebrate classes and in different parts of the
optic pathway may underlie the architectural differences and may explain
differences in the ultimate targets chosen by retinal ganglion cell growth
cones. Similarly, a relaxation in substrate preferences in the optic nerve
of mammals may also account for the considerable degree of mixing among
fibers.
Acknowledgements
This study was supported by grants from the National Eye Institute to RWW and PR. We thank Joseph Musco for excellent technical assistance. We thank Evan G. Williams, Alexander G. Williams, and Kathryn Graehl for production and editing of the html edition of this paper.
References
Agiro V, Bunge MB, Johnson MI (1984) Correlation between growth (cone) form and movement and their dependence on neuronal age. J Neurosci 4:3051–3062.
Bastiani MJ (1985) Neuronal specificity and growth cone guidance in grasshopper and Drosophila embryos. Trends Neurosci 8:257–266.
Bodick N, Levinthal C (1980) Growing optic nerve fibers follow neighbors during embryogenesis. Proc Natl Acad Sci USA 77:4374–4378.
Bonhoeffer F, Huf J (1985) Position-dependent properties of retinal axons and their growth cones. Nature 351:405–410.
Bovolenta P, Mason C (1987) Growth cone morphology varies with position in the developing mouse visual pathway from retina to first targets. J Neurosci 7:1447–1491.
Bunge MB (1973) Fine structure of nerve fibers and growth cones of isolated sympathetic neurons in culture. J Cell Biol 56:713–735.
Bunt SM (1982) Retinotopic and temporal organization of the optic nerve and tracts in the adult goldfish. J Comp Neurol 206:209–226.
Cheng TPO, Reese TS (1985) Polarized compartmentalization of organelles in growth cones from developing optic tectum. J Cell Biol 101:1473–1480.
Cima C, Grant P (1982) Development of the optic nerve in Xenopus laevis. I. Early development and organization. J Embryol Exp Morphol 72:225–249.
Davies AM (1989) Intrinsic differences in the growth rate of early nerve fibres related to target distance. Nature 337:553–555.
Easter SS Jr, Rusoff AC, Kish PE (1981) The growth and organization of the optic nerve and tract in juvenile and adult goldfish. J Neurosci 1:793–811.
Easter SS Jr, Bratton B, Scherer SS (1984) Growth-related order of the retinal fiber layer in goldfish. J Neurosci 4:2173–2190.
Fraser SE, Murray BE, Choung C-M, Edelman GE (1984) Alteration of the retinotectal map in Xenopus by antibodies to neural cell adhesion molecules. Proc Natl Acad Sci USA 81:4222–4226.
Froriep O (1906) Die Entwickelung des Auges der Wirbeltiere. In: Handbuch der vergleichenden und experimentellen Entwickelungslehre der Wirbeltiere, Vol 2, Pt 2 (Hertwig O, ed), pp 139–266. Jena: Fischer.
Godement P, Vanselow J, Thanos S, Bonhoeffer F (1987) A study in developing visual system with a new method of staining neurones and their processes in fixed tissue. Development 101:697–713.
Guillery RW, Walsh C (1987) Changing glial organization relates to changing fiber order in the developing optic nerve of ferrets. J Comp Neurol 265:203–217.
Halfter W, Deiss S (1984) Axonal growth in embryonic chick and quail retinal whole mounts in vitro. Dev Biol 102:344–355.
Harris WA (1986) Homing behaviour of axons in the embryonic vertebrate brain. Nature 320:266–269.
Holt CE (1989) A single-cell analysis of early retinal ganglion cell differentiation in Xenopus: from soma to axon tip. J Neurosci 9:3123–3145.
Hoyt WF, Luis O (1962) Visual fiber anatomy in the infragranular pathway of the primate. Arch Ophthalmol 68:124–136.
Kapfhammer JP, Raper RA (1987) Interactions between growth cones and neurites growing from different neural tissues in culture. J Neurosci 7:1595–1600.
Keibel F (1889) Ueber die Entwickelung des Sehnerven. Dtsch Med Wochenschr 15:116.
Krayanek S, Goldberg S (1981) Oriented extracellular channels and axonal guidance in the embryonic chick retina. Dev Biol 84:41–50.
LaVail MM, Rapaport D, Rakic P (1991) Cytogenesis in the monkey retina. J Comp Neurol, in press.
Maggs A, Scholes J (1986) Glial domains and nerve fiber patterns in fish retinotectal pathway. J Neurosci 6:424–438.
McLoon SC (1985) Evidence for shifting connections during development of the chick retinotectal projection. J Neurosci 5:2570–2580.
McLoon SC, McLoon LK, Palm SL, Furcht LT (1988) Transient expression of laminin in the optic nerve of the developing rat. J Neurosci 8:1981–1990.
Moorman SJ, Hume RI (1990) Growth cones of chick sympathetic preganglionic neurons in vitro interact with other neurons in a cell-specific manner. J Neurosci 10:3158–3163.
Naito J (1986) Course of retinogeniculate projection fibers in the cat optic nerve. J Comp Neurol 251:376–387.
Naito J (1989) Retinogeniculate projection fibers in the monkey optic nerve: a demonstration of the fiber pathways by retrograde axonal transport of WGA-HRP. J Comp Neurol 284:174–186.
Nordlander RH (1987) Axonal growth cones in the developing amphibian spinal cord. J Comp Neurol 263:485–496.
Nordlander RH, Singer M (1982) Morphology and position of growth cones in the developing Xenopus spinal cord. Dev Brain Res 4:181–193.
Polyak S (1957) The vertebrate visual system. Its origin, structure, and function and its manifestations in disease with an analysis of its role in the life of animals and in the origin of man, Chap 6 (Klüver H, ed), pp 288–389. Chicago: University of Chicago.
Rager G (1980a) Die Ontogenese der retinotopen Projektion. Beobachtung und Reflexion. Naturwissenschaften 67:280287.
Rager G (1980b) Development of the retinotectal projection in the chicken. Adv Anat Embryol Cell Biol 63:192.
Rager G (1983) Structural analysis of fiber organization during development. Prog Brain Res 58:313–319.
Rakic P, Riley KP (1983) Overproduction and elimination of retinal axons in the fetal rhesus monkey. Science 219:1441–1444.
Robinson A (1896) On the formation and structure of the optic nerve, and its relation to the optic stalk. J Anat Physiol 30:319–333.
Sapiro JA, Silver J, Singer M (1980) Orderly fasciculation in the early optic nerve of Xenopus laevis. Soc Neurosci Abstr 6:297.
Schlosshauer B, Schwarz U, Rutishauser U (1984) Topological distribution of different forms of neural cell adhesion molecule in the developing chick visual system. Nature 310:141–143.
Scholes JH (1981) Ribbon optic nerves and axonal growth patterns in the retinal projection to the tectum. In: Development in the nervous system (Garrod DR, Feldman JD, eds), pp 181–214. Cambridge: Cambridge UP.
Seefelder (1910) Beiträge zur Histogenese und Histologie der Netzhaut, des Pigmentepithels und des Sehnerven. (Nach Untersuchungen am Menschen), plates 16, 17. Albrecht Von Graefes Arch Ophthalmol 73:419–537.
Silver J (1984) Studies on the factors that govern directionality of axonal growth in the embryonic optic nerve and at the chiasm of mice. J Comp Neurol 223:238–251.
Silver J, Rutishauser U (1984) Guidance of optic axons in vivo by a preformed adhesive pathway on neuroepithelial endfeet. Dev Biol 106:485–499.
Silver J, Sapiro J (1981) Axonal guidance during development of the optic nerve: the role of pigmented epithelia and other extrinsic factors. J Comp Neurol 202:521–538.
Silver J, Lorenz SE, Wahlsten D, Coughlin J (1982) Axonal guidance during development of the great cerebral commissures: descriptive and experimental studies, in vivo, on the role of preformed glial pathways. J Comp Neurol 210:10–29.
Singer M, Nordlander RH, Egar M (1979) Axonal guidance during embryogenesis and regeneration. The blueprint hypothesis of neuronal pathway patterning. J Comp Neurol 185:1–22.
So KF, Aguayo AJ (1985) Lengthy regrowth of cut axons from ganglion cells after peripheral nerve transplantation into the retina of adult rats. Brain Res 328:349–354.
Taylor JSH (1987) Fibre organization in Xenopus retinotectal projection. Development 99:393–410.
Thanos S, Bonhoeffer F, Rutishauser U (1984) Fiber-fiber interaction and tectal cues influence the development of the chicken retinotectal projection. Proc Natl Acad Sci USA 81:1906–1910.
Torrealba F, Guillery RW, Polley EH, Mason CA (1982) Studies of retinal representations within the cat’s optic tract. J Comp Neurol 211:377–396.
Tosney KW, Landmesser L (1985) Growth cone morphology and trajectory in the lumbosacral region of the chick embryo. J Neurosci 5:2345–2358.
Udin SB, Fawcett JW (1988) Formation of topographic maps. Annu Rev Neurosci 11:289–327.
Walsh C, Price 5, Guillery RW (1985) Glial structure in relation to fiber order in the ferret’s optic stalk. Soc Neurosci Abstr 11:15.
Williams RW, Rakic P (1984) Form, ultrastructure, and selectivity of growth cones in the developing primate optic nerve: 3-dimensional reconstructions from serial electron micrographs. Soc Neurosci Abstr 10:373.
Williams RW, Rakic P (1985) Dispersion of growing axons within the optic nerve of the embryonic monkey. Proc Natl Acad Sci USA 82:3906–3910.
Williams RW, Rakic P (1987) Growth cone assortment in the optic chiasm of fetal monkeys. Soc Neurosci Abstr 14:580.
Williams RW, Bastiani MJ, Lia B, Chalupa LM (1986) Growth cones, dying axons, and developmental fluctuations in the fiber population of the cat’s optic nerve. J Comp Neurol 246:32–69.
![]()
Contents
- Abstract
- Introduction
- Materials and Methods
- Ultrastructural criteria of growth cones
- Quantification of growth cone number by analysis of serial sections
- Results
- The early stage of axon ingrowth
- A quantitative test of growth cone criteria
- The second stage of nerve development
- Growth cones in all regions of the nerve
- Left-right asymmetries
- Growth cone traffic patterns in the nerve
- Discussion
- Shapes of growth cones
- Spatial gradients of growth cones
- An argument on substrate guidance
- Differences among vertebrate classes
- Acknowledgments
- References
Received June 12, 1990; revised Nov. 21, 1990; accepted Nov. 27, 1990;
published April 1991
HTML edition created Aug. 1, 1998 by EGW, AGW, and RWW; updated Aug. 2,
1998 by RWW.
Since 11 August 98