Note to the Reader This is a preprint of a paper now in press at the Journal of Neuroscience.
Revised HTML edition available at <http://nervenet.org/papers/cerebellum2000.html>
Cite as: Airey DC, Lu L, Williams RW (2001) Genetic control of the mouse cerebellum: identification of quantitative trait loci modulating size and architecture. J Neurosci, in press.
Contents Introduction
Genetic control of the mouse cerebellum: Identification of quantitative
trait loci modulating size and architecture
David C. Airey, Lu Lu, Robert W. Williams
Center for Neuroscience and Department of Anatomy and Neurobiology,
University of Tennessee, 855 Monroe Avenue, Memphis, Tennessee 38163 USA
Email questions and comments to dairey@nb.utmem.edu
Methods
Results
Table 1: BXD strain means for cerebellar
phenotypes
Table 2: Linkages for Adjusted Cerebellar Weight
in BXD Mice
Table 3: Linkages for Adjusted Cerebellar Weight
in BXD Mice
Table 4: Linkages for Adjusted Internal Granule
Volume in BXD Mice
Table 5: Linkages for Adjusted Cerebellar "White
matter" (Total Volume – IGL Volume) in BXD Mice
Table 6: Linkages for Adjusted Cerebellar Weight
in F2 Mice
Table 7: Epistasis ANOVA for QTLs Controlling
Cerebellar Weight in BXD Mice.
Figure 1: Cerebellar Phenotypes
Figure 2: Distribution of F2
Cerebellar Weights
Figure 3: Interval Maps of
Cerebellum QTLs
Discussion
Specificity of QTL Action
Candidate Genes
ABSTRACT
To discover genes influencing cerebellum development, we conducted a complex trait analysis of variation in the size of the adult mouse cerebellum. We analyzed two sets of recombinant inbred BXD strains and an F2 intercross of the common inbred strains, C57BL/6J and DBA/2J. We measured cerebellar size as the weight or volume of fixed or histologically processed tissue. Among BXD recombinant inbred strains, the cerebellum averages 52 mg (12.4% of the brain) and ranges 18 mg in size. In F2 mice, the cerebellum averages 62 mg (12.9% of the brain) and ranges about 20 mg in size. Five QTLs that significantly control variation in cerebellar size were mapped to chromosomes 1 (Cbs1a), 8 (Cbs8a), 14 (Cbs14a), and 19 (Cbs19a, Cbs19b). In combination, these QTLs can shift cerebellar size an appreciable 35% of the observed range. To assess regional genetic control of the cerebellum, we also measured the volume of the cell-rich, internal granule layer (IGL) in a set of BXD strains. The IGL ranges from 34 to 43% of total cerebellar volume. Variation in the cell-rich IGL volume is strongly linked to the Cbs8a, indicating the action of this QTL is regionally specific. There is also evidence that Cbs8a is linked to the number of cerebellar folia, recorded previously by Neumann et al. (1993) for the BXD strains. The QTLs we have discovered are the first loci shown to modulate the size and architecture of the adult mouse cerebellum.
Introduction
In vertebrates, the cerebellum displays striking quantitative and
structural diversity, ranging from a simple, flat sheet in turtles and
frogs to an enormous, hyperfolded configuration in mormyrid fish (Butler
and Hodos, 1996; Voogd and Glickstein, 1998). Even among closely related
primate species, the cerebellum displays important differences in size and
form (Rilling and Insel, 1998; Barton and Harvey 2000; Finlay and
Darlington, 1995). The internal cellular composition of the cerebellum,
however, is highly conserved: three laminae overlay internal white matter
and deep cerebellar nuclei in most taxonomic groups. The contrast between
highly variable size and shape yet tightly conserved programs of cell
differentiaton indicates that genetic modulation of the vertebrate
cerebellum is primarly quantitative in nature (Llinas and Walton, 1998).
Adaptive changes in common genetic programs most likely involve the
proliferation or survival of neurons and glial cells.
The cerebellum is an ideal structure in which to study the molecular
and genetic networks controlling morphogenesis in the central nervous
system. The laminar cytoarchitecture and modular structure of the
cerebellum facilitates the study of developmental compartments (e.g.,
Herrup and Kuemerle, 1997; Eisenman et al., 1998; Nunzi et al., 1999) as
well as the study of single-gene mutations (Goldowitz and Eisenman, 1992;
Heintz and Zoghbi, 2000). The networks of genes that are critical in
cerebellar development are beginning to be identified (Goldowitz and Hamre,
1998; Oberdick et al., 1998). However, relatively little is known about
the genetic causes of substantial variance in the cerebellum between
individuals within a species.
Allelic variants in concert with environmental influences during
development give rise to the quantitative variation among individuals.
Approximately 20% of genes are polymorphic in rodents (Maynard Smith,
1998). Recent advances in quantitative genetics allow neurogeneticists to
identify the gene loci that generate quantitative variation. This forward
genetic approach, i.e., from trait to gene, initially involves associating
differences in alleles near defined marker loci with differences in the
relevant trait. A strong statistical association indicates the location
and effect size of a quantitative trait locus, or QTL (Darvasi, 1998;
Williams, 2000). By taking advantage of differences between normal strains
of mice, we have recently mapped gene loci that specifically modulate
numbers of neurons in mouse retina (Williams et al., 1998; Strom and
Williams, 1998; Strom, 1999), olfactory bulb weight (Williams et al.,
2000), and hippocampus (Lu et al., 2000). Because of the high degree of
conservation between mouse and human genomes, identification of gene
variants in the mouse may aid discovery of homologues in humans.
In the present study we have initiated a neurogenetic analysis of
the normal adult mouse cerebellum. The only literature for individual
differences in cerebellar anatomy concerns folial pattern (e.g., Inouye
and Oya, 1980; Neumann et al., 1993). Neumann et al. (1993) reported three
loci that have quantitative effects on the number of cerebellar folia in
mice derived from the C57BL/6J and DBA/2J inbred strains. Using
experimental crosses of mice derived from these same strains, we have
started our analysis by first considering genes that affect total
cerebellar size and the size of the cell-rich internal granule layer. We
demonstrate that differences in cerebellar anatomy are generated in part
by a set of five QTLs with relatively large effects that map to
chromosomes 1, 8, 14, and 19.
Material and Methods
Mice. Three complementary sets of mice were used in this study (n = 514). These included two sets of BXD recombinant inbred (RI) strains and a set of F2 progeny. The RI strains and F2 progeny were generated from the inbred strains C57BL/6J (B for short) and DBA/2J (D for short). RI mice are inbred lines derived from brother-sister matings starting from an F2 intercross. In general, RI strains, when compared to F2 mice, provide lower power but increased mapping resolution for QTL detection. This is because RI sets are small (usually less than 30 strains) but harbor 3.5–4 times as many recombination events compared to F2 mice. Because they are inbred, RI lines also allow greater precision in phenotyping. The average of several mice can represent the mean value for a strain. The BXD RI strains were generated by Dr. B. A. Taylor (Taylor, 1989; Taylor 1999), and purchased from Jackson Laboratory (Bar Harbor, Maine) from 1994 through 1999 (n = 334). The parental strains used to generate F2 mice were purchased from Jackson Laboratory. The F2 animals were generated at the University of Tennessee (UT) by intercrossing both BDF1 and DBF1 mice as described in Zhou and Williams (1999). One hundred and five of these F2 mice were BDF2s and 75 were DBF2s. Mice were maintained at 20–24 °C on a 14:10 on:off photoperiod in a pathogen-free colony at UT. Most animals were provided with water and a 5% fat Agway Prolab 3000 rat and mouse chow ad lib. The average age of the BXD RI strains was approximately 80 days (range ~30–300), and that of the F2 mice was 100 days (range ~70–160). Both females and males were studied.
Tissue Preparation and Analysis. Mice were deeply anesthetized with
Avertin (1.25% 2,2,2-tribromoethanol and 0.8% tert-pentyl alcohol in
water, 0.8–1.0 ml ip) and weighed to the nearest 0.1 g. Most mice were
perfused transcardially with 0.1 M phosphate buffered saline (PBS)
followed first by 1.25% glutaraldehyde and 1.0% paraformaldehyde in 0.1M
PBS, and then by 2.5% glutaraldehyde and 2.0% paraformaldehyde in 0.1M
PBS.
Brains from BXD and F2 mice were dissected from the skull, sectioned
free of the spinal cord and cranial nerves, rolled briefly on tissue
paper, and weighed to the nearest 0.1 mg. All weights were recorded at
room temperature. The cerebellum was dissected free of each brain by
inserting a small knife parallel to the dorsal hindbrain surface to cut
the peduncles. Two persons dissected cerebellar weights from BXD mice.
Technical error was controlled prior to QTL mapping by using a covariate
term (coded as a dummy or indicator variable; see Table 1 note 2).
In a second set of BXD mice, brain, cerebellum, and IGL volumes were
measured from celloidin-embedded Nissl stained sections available from the
Mouse Brain Library (Williams and Rosen, www.mbl.org). Brain and
cerebellum volumes were estimated by summing the areas measured across
sections and multiplying the sum by the sampling interval (0.30 mm). This
method does not differ significantly from Cavalieri’s method for the
number of sections per mouse (>10) measured (Rosen and Harry, 1990).
Measurements were made on slide images using NIH-Image software. The
volume of the internal granule layer was measured using the density slice
feature of NIH Image (Fig. 1). Cerebellum and IGL volumes were corrected
for differences in tissue shrinkage by dividing by the total brain volume
and multiplying by the brain volume expected from the known brain weight,
assuming a uniform brain density of one milligram per cubic millimeter of
fixed tissue.
Genotyping. Genomic DNA from F2 mice was extracted from the spleen using a high salt procedure (Laird et al., 1991). Spleens were removed under anesthesia just prior to perfusion. A set of 128 microsatellite loci distributed across all autosomes and the X chromosome was typed in the F2 progeny using a modified protocol of Love et al. (1990) and Dietrich et al. (1992). Each 10 µl PCR reaction contained 1x PCR buffer, 1.92 mM MgCl2, 0.25 units of Taq DNA polymerase, 0.2 mM of each deoxynucleotide, 132 nM of the primers and 50 ng of genomic DNA. The microsatellite primers were purchased from Research Genetics (Huntsville, AL). A loading dye (60% sucrose, 1.0 mM cresol red) was added to the reaction before the PCR (Dietrich et al., 1994). PCRs were carried out in 96-well microtiter plates. A high stringency touchdown protocol was used to lower the annealing temperature progressively from 60 °C to 50 °C in 2 °C steps over the first 6 cycles (Don et al., 1991). After 30 cycles, PCR products were run on 2.5% Metaphor agarose gels (FMC Inc., Rockland ME), stained with ethidium bromide, and photographed. Genotypes were scored, entered into Microsoft Excel 98, formatted, and exported to Map Manager QT and Map Manager QTX (Olson and Manly, 1999). A nonredundant set of ~320 loci typed for all 35 BXD RI strains was used for analysis as described in Williams et al., (1998) and Zhou and Williams (1999).
Statistics. Regression analysis was carried out to explore and
remove (i.e., statistically control) covariance between cerebellum or IGL
size and other variables before QTL mapping. The primary purpose of this
analysis was to provide protection against claiming that a gene effect is
specific to cerebellum or IGL size when the effect is more general, e.g.,
a whole brain or body effect. Our variables included cerebellum weight
(mg) or volume (mm3), IGL volume (mm3),
brain weight (mg) or volume (mm3), body weight
(g), sex, and age (days). The regression analysis resulted in a set of new
brain phenotypes based on the residuals from linear regression models;
these "adjusted" phenotypes were used for gene mapping. A secondary
purpose of the regression analysis was to understand relations between
brain phenotypes and factors like sex or age. Regression models were
computed with Data Desk 6.1 (www.datadesk.com). Interaction terms were
explored in each model and excluded from final models when not
significant. Alternatives to this regression analysis include multiple
trait QTL analysis (Jiang and Zeng, 1995) or the use of covariates during
single trait QTL analysis (Map Manager QT manual). We chose single trait
QTL analysis because we were specifically interested in cerebellum QTLs.
We chose to control variance related to factors like brain size, sex, and
age before QTL mapping, because these factors are of independent
biological interest and potentially confounding.
Map Manager QT and QTX programs (Olson and Manly, 1999) were used for
QTL mapping. In essence, QTL mapping divides a panel of mice into groups
based on their genotypes (e.g., BB or DD in the case of RI
strains and BB, BD, and DD in the case of F2 progeny)
at defined chromosomal loci and compares these groups using a quantitative
phenotype (e.g., cerebellum weight). QTL mapping generally proceeds from
analysis at defined loci (single marker analysis), to positions inferred
between loci (simple interval mapping), and then to positions inferred
between loci but with statistical control for other loci known to affect
the trait (composite interval mapping). Interval mapping helps to better
localize QTLs between markers. Composite interval mapping helps to
understand the independent or incremental effects of QTLs. By controlling
for multiple unlinked QTLs the power to detect secondary QTLs may also be
increased substantially. In our genome scans we first mapped our phenotype
against genotype data on a locus-by-locus basis to assess linkage. Loci
with LOD (logged likelihood of odds) scores greater than ~2.8 were
considered suggestive (Lander and Kruglyak, 1995). Chromosomes harboring
suggestive loci were analyzed by simple interval mapping. When more than
one locus was identified, composite interval mapping was used. Map Manager
QT and QTX implement simple and composite interval mapping using methods
described by Haley and Knott (1992). Genome-wide (experimentwise)
significance probabilities for mapped QTLs were estimated by comparing
peak likelihood ratio statistics (LRS = LOD x 4.6) of correctly ordered
data sets with those computed for 10,000 permutations of the phenotype
data (Churchill and Doerge, 1994). Probabilities reported below as
"genome-wide" (PG) reflect correction for
multiple tests; other reported probabilities are comparisonwise.
Confidence of QTL position is given as the 2-LOD support interval that
bounds the QTL with ~95% confidence (Lynch and Walsh, 1998).
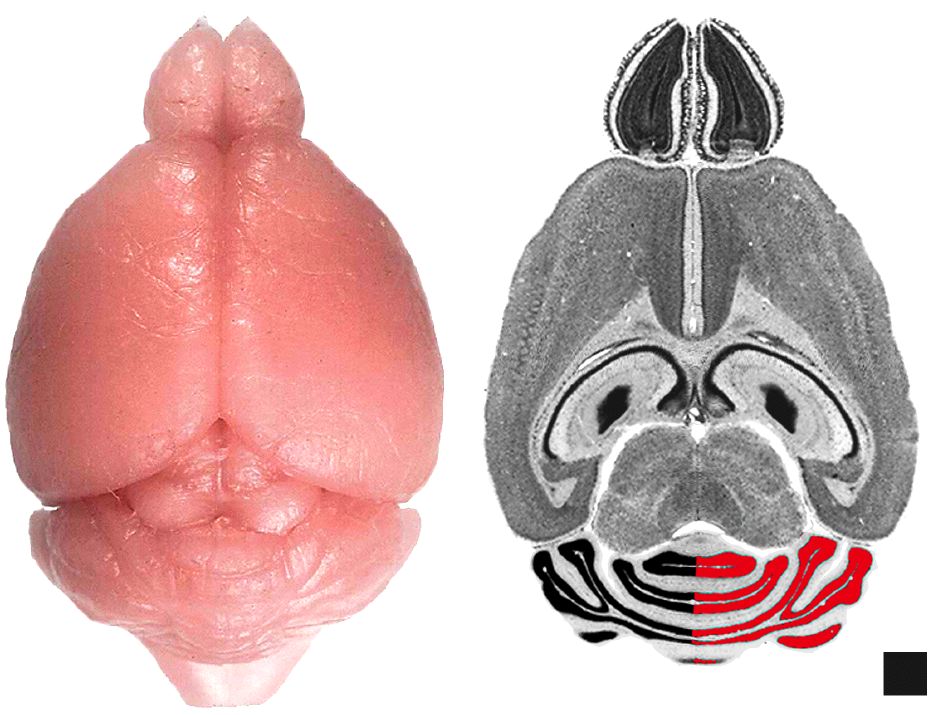
Figure 1. Dissecting the cerebellum. (A) Dorsal view of a fixed mouse brain. (B) Horizontal section from the Mouse Brain Library illustrating the method used to measure IGL volume. Half of the IGL is measured here for illustrative purposes only. Scale block is 1 x 1 mm.
Results
Our results are divided into two parts. The first section describes the normative phenotypic measures and their relation to differences in sex, age, body weight, and brain weight. The second section presents evidence for QTLs modulating cerebellar size and structure.
Cerebellar Size and Variation
Parental Cerebella
The cerebella of C57BL/6J mice are on average 18% larger (F1,58 = 110, P < .0001) than those of DBA/2J mice—59.6 ± 0.52 mg (n = 36, 15 male, 21 female) versus 50.5 ± 0.73 mg (n = 24, 11 male, 13 female). Male and female mice do not differ in cerebellar weight within these strains. Despite the significant 18% difference in absolute size, the cerebellum makes up approximately 12% of total brain weight in both strains. This contrast highlights the importance of assessing specificity of gene effects, or the need to determine whether loci affect cerebellar size directly or indirectly (e.g., through brain of body size).
BXD Cerebella
The random assortment of multiple alleles at different loci will often generate much greater differences among RI strains than between the parental strains (Neumann et al., 1993, Williams et al., 2000; Lu et al., 2000). This is definitely the case for the cerebella of BXD strains. Weights range from a low of 45.9 ± 1.09 mg in BXD12 to a high of 62.5 ± 2.32 mg in BXD5 (Table 1). In a separate sample of BXD mice, cerebellar volumes range from 43.1 ± 1.21 mm3 in BXD23 to 62.9 ± 3.55 mm3 in BXD5. Strain distribution patterns for either measure of cerebellar size do not depart significantly from normality (Kolmogorov tests), arguing that the strain differences are polygenic in origin (cf. Williams et al., 1998). The correlation between strain means for cerebellar weight and volume is high and significant (r = .86, P < .0001). Using ANOVA with strain as the single factor, strain differences are significant for cerebellar weight (R2 = 67.5%, F33,144 = 9.1, P < .0001) and volume (R2 = 51.9%, F30,124 = 4.5, P < .0001). Using estimates of environmental and genetic influences on cerebellum size from within strain and between strain variances, the heritability is approximately 47% and 33% for weight and volume, respectively (Hegmann and Possidente, 1981).
F2 Cerebella
The average cerebellar weight of 180 F2 mice is 61.5 ± 0.33 mg. The distribution of cerebellar weight in F2 mice is bell-shaped and is not significantly different from a normal distribution (Kolmogorov test; Figure 2). Cerebellar weight in the F1 mice averages 62.1 ± 0.63 mg (n = 46). In a single factor ANOVA with F1, F2, and parental mice, the parental strains differ from each other (Scheffe post-hoc test; P < .0001), F1 mice differ from D mice (P < .0001) but not B mice (P = .10), and F1 and F2 mice do not differ significantly (P = .80). Using variances in the isogenic F1 and heterogeneous F2 samples, (VF2 – VF1) / VF2, heritability of cerebellum weight is 23%.
BXD and F2 Differences
There are significant differences between the F2 and BXD mice: cerebellar weight is on average 10 mg heavier, brain weight is 45 mg heavier, and body weight is 6.7 g heavier in F2 mice. The age and sex composition of our samples are also somewhat different. The F2 mice are on average 10 days older but the age range is comparatively narrow (66–156 days versus 30–300 days). The F2 sample is 52% female whereas the BXD sample is 44% female. The cerebellar weight of F2 cases are still significantly higher (4 mg) after adding covariates for brain weight, body weight, sex, and age (F1,344 = 53, P < .0001). The increased size of F2 mice likely reflects heterosis of the non-inbred F2 progeny and F1 maternal superiority (Lynch and Walsh, 1998).
Cerebellar Covariate Analysis
Sex is not associated with differences in cerebellar size. When
restricted to 19 BXD strains for which both sexes were replicated, no sex
difference is evident (F1,100 = 0.21, P = 0.65).
Sex is also not an important predictor in either BXD cerebellar volume (F1,88
= 0.14, P = .71; 18 strains) or F2 cerebellar weight (F1,178
= 0.03, P = .86).
Increased body weight is weakly associated with larger cerebella. In
BXD mice, body weight has a correlation of 0.36 with cerebellar weight (df
= 162, P < .0001), and 0.34 with cerebellar volume (df = 148, P < .0001).
In the F2 data set, the correlation is 0.19 (df = 177, P = .014).
Age is also weakly associated with cerebellar size. In BXD mice,
cerebellar weight correlates 0.27 with age (df = 174, P = .0003, 30 to 300
days, log transformed) and cerebellar volume correlates 0.19 with age (df
= 150, P = .01). We did not detect any increase in cerebellar weight
within the more restricted age sample of the F2 mice.
Brain size is strongly associated with cerebellar size. Cerebellar
weight among BXD strains has a correlation of 0.70 with brain weight (df =
176, P < .0001); for volume the correlation is 0.53 (df = 153, P < .0001).
Cerebellar weight in F2 mice has a correlation of 0.72 with brain weight (df
= 178, P < .0001).
Adjusted Cerebellar Size
In multiple regression models including sex, body, age, and brain, only brain size is an important predictor of cerebellum for both BXD and F2 mice. Interactions are not significant. For these reasons, simple additive models including only brain weight or volume were used to create a set of adjusted measures for QTL mapping (Table 1 for adjusted BXD measures; Figure 2 for adjusted F2 measures). Strain differences are still highly significant even after correction for differences in brain weight (R2 = 80.3%, F33,144 = 17.78, P < .0001) or brain volume (R2 = 45%, F33,124 = 3.43, P < .0001).
Internal Granule Layer Volume
The volume of the internal granule layer ranges from a low of 14.5 ± 0.57 mm3 in BXD20 to a high of 23.0 ± 0.20 mm3 in BXD5 (Table 1). As a percentage of cerebellar volume, the IGL ranges from 33.6 ± 2.2% (BXD14) to 42.9 ± 2.9% (BXD22). Strains differences are again highly significant (R2 = 52%, F30,124 = 4.42, P < .0001). Heritability for IGL volume is approximately 31%. The correlation between strain means (an estimate of the genetic correlation) for IGL volume and the remaining cerebellum volume (molecular layer, internal white matter, and deep nuclei) is 0.62 (df = 29, P = .0002). This correlation remains significant after variance associated with brain volume is removed (r = 0.41, df = 29, P = .02).
IGL Covariate Analysis
Sex is not associated with differences in IGL volume. When restricted
to 18 BXD strains for which both sexes are replicated, no sex difference
is evident (F1,88 = 0.27, P = .61). Males and
females are also not different in the volume of the rest of the cerebellum
(F1,88 = 0.01, P = .91).
Body weight is weakly associated with IGL volume (r = 0.17, df = 148,
P = .03), but more strongly associated with the rest of the cerebellum (r
= 0.36, df = 148, P < .0001).
As with body weight, there is a dissociation between the effects of
age on IGL volume and the volume of the rest of the cerebellum. Age (log
transformed) does not correlate with IGL volume (r = 0.05, df = 150, P =
.50), but does correlate with the remaining cerebellar volume (r = 0.23,
df = 150, P = .004).
Larger brains are positively associated with both greater IGL volume
and the volume of the rest of the cerebellum. Brain volume is moderately
correlated with IGL volume (r = 0.40, df = 153, P < .0001) and with the
rest of the cerebellum (r = 0.46, df = 153, P < .0001).
Adjusted IGL Volume
As was true for cerebellum size, analysis by multiple regression shows that only brain size significantly predicts IGL volume when sex, body, and age covariates are included. Interactions are not important predictors. A simple additive model including only brain volume was again used to create a set of adjusted IGL measures (see Table 1). In contrast, the volume of the remainder of the cerebellum is predicted better by two factors—brain volume (t1,147 = 4.69, P < .0001) and body weight (t1,147 = 2.50, P = .01). Strain differences are significant for adjusted IGL volume (R2 = 48%, F30,124 = 3.8, P < .0001) and marginal for the adjusted cerebellar white matter (R2 = 28%, F30,119 = 1.6, P = 0.05).
QTL Mapping
QTLs Affecting Cerebellar Weight in BXD mice
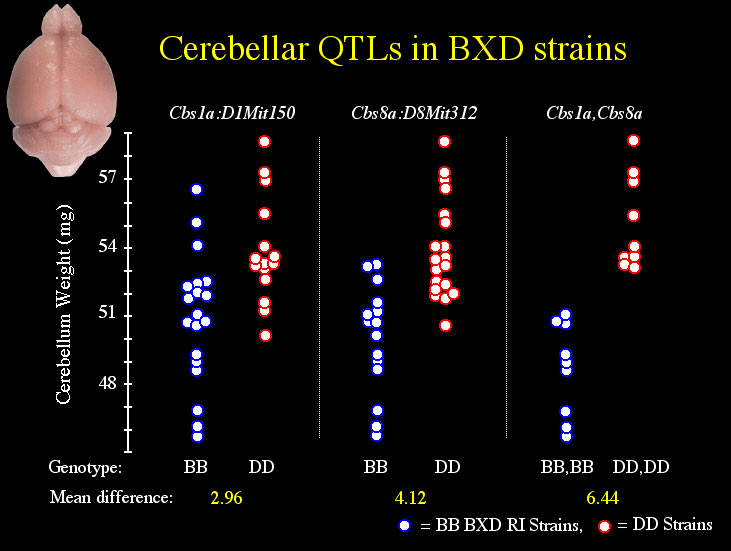
Single marker analysis shows that variation in adjusted cerebellar weight is associated with the pattern of B and D alleles at several microsatellite markers (Table 2), but linkages to distal Chr 8 and 1 appear strongest. Simple interval mapping of Chr 8 shows the tightest linkage (LRS = 22.5) to be just distal of D8Mit312 at 45 cM. At this locus 47% of the variance in cerebellar weight is explained, and each B allele is associated with a decrease of 2.5 mg (Fig. 3, panel A). The genome-wide significance for this linkage is PG = .0006. With control for D8Mit312, composite interval mapping reveals a secondary QTL near D1Mit150 at 100 cM on Chr 1 (LRS = 15, PG = .06). At this locus, 18% of the variance in cerebellar weight is independently explained, and each B allele is associated with a decrease of 1.3 mg (Fig. 3, panel B). Collectively, these QTLs control 60% of the variance in adjusted cerebellar weight among BXD strains. A 6.4 mg difference in weight characterizes BXD strains with BB (n = 9) or DD (n = 9) alleles at both loci.
QTLs Affecting Cerebellar Volume in BXD mice
Single marker analysis shows that variation in adjusted cerebellar volume is also associated with the pattern of B and D alleles on distal Chr 8 and Chr 1 (Table 3). Simple interval mapping of Chr 8 again shows the strongest linkage (LRS = 19.7) to be distal to D8Mit312. At this locus, 45% of the variance in cerebellar volume is explained, and each B allele is associated with a decrease of 2.7 mm3 (Fig. 3, panel C). The genome-wide significance for this linkage is PG = .01. Interval mapping of Chr 1 shows the strongest linkage to be between the markers D1Mit113 and D1Mit150 (LRS = 15.6, PG = .05). At this locus, 38% of the variance in cerebellar volume is explained, and each B allele decreases the volume by 2.1 mm3. With control for D8Mit312, composite interval mapping shows a significant independent effect for the Chr 1 locus (LRS = 19.4, PG = .013, R2 = 27%, B = –1.8 mm3) (Fig. 3, panel D). Collectively, these QTLs control 64% of the variance in adjusted cerebellar volume among BXD strains. As shown below, a 6.0 mm3 difference in volume characterizes BXD strains with BB (n = 8) or DD (n = 9) alleles at both loci.
The position, as well as the direction and magnitude of effect size, of the loci on distal Chr 8 and Chr 1 are comparable in both cerebellar weight and volumetric data. Thus, separate data on cerebellar volume and weight collected from independent samples of BXD mice reinforce the discovery of two QTLs that affect cerebellum size in BXD mice. We have named these QTLs Cerebellar Size 8a (Cbs8a: Chr 8) and Cerebellar Size 1a (Cbs1a: Chr 1).
QTLs Affecting IGL Volume in BXD mice
The volume of the cell-dense, internal granule layer, is more strongly linked to Cbs8a and Cbs1a than to any other microsatellite tested (Table 4). Simple interval mapping of Chr 8 shows the strongest linkage (LRS = 14.2, PG = .08) to be distal to D8Mit312 at 45 cM. At this locus, 35% of the variance in IGL volume is explained, and each B allele is associated with a decrease of 1.3 mm3. For the volume of the rest of the cerebellum, the strongest linkage is to Chr 4 (D4Mit303 at 48.5 cM, Table 5). Interestingly, B alleles at D4Mit303 add volume to the white matter. However, this putative locus attains only suggestive genome-wide significance (LRS = 13.0, pG = .13). The next strongest linkages are the familiar Cbs8a and Cbs1a loci, but neither these loci nor any others attain genome-wide significance (PG = .53 at Cbs8a).
Cbs8a is linked to the number of cerebellar folia
Neumann and colleagues (1993) previously reported that three intervals on chromosomes 5, 7, and 11 affect cerebellar folial number in 26 BXD strains. We remapped the data given in their paper with the larger set of genetic markers used in our study. We verified the linkages to chromosomes 5, 7, and 11, and we also discovered that Cbs8a is putatively linked to the number of fissures (LRS = 8.3, P = .0054). BXD strains with D alleles at D8Mit312 have on average one more fissure that strains with B alleles.
QTLs Affecting Cerebellar Weight in F2 mice
Single marker analysis of the F2 mice reveals extremely strong linkage to distal Chr 1; and more moderate linkages to Chrs 14 and 19 (Table 6). Simple interval mapping of Chr 1 indicates an LRS of 60.0 near to D1Mit57 at 100 cM. The genome-wide significance of this LRS is PG < 0.0001. At this locus, 30% of the variance in adjusted cerebellum weight is explained, and each B allele decreases cerebellar weight by 2.2 mg. D alleles are dominant at this locus, and the dominance deviation amounts to 1.0 mg. The 2-LOD support interval for this locus–81 cM to 92 cM–overlaps that observed for the Chr 1 locus in the BXD strains of 89 cM to 102 cM (Fig. 3, panel E). This strong linkage is therefore compelling support for Cbs1a.
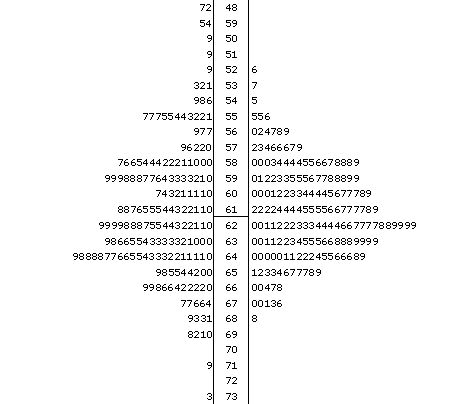
Figure 2. Distribution of cerebellar weights in the F2 intercross as illustrated by stem-and-leaf plots. The values on the left are the observed values, those on the right reflect correction by regression for brain weight. The mean for both distributions is marked by a horizontal line. From this graph, the distributions are illustrated, and the original data is presented. For example, the right distribution shows an overall normal curve, and that there are three cases with the adjusted cerebellar weights between 55 and 56 mg (55.5, 55.5, and 55.6 mg).
Permutation analysis places the genome-wide PG = 0.05 for the F2 data at an LRS of 16.9. Other than Chr 1, only the association with D14Mit207 located at 7.7 cM on Chr 14 attains genome-wide significance. We refer to this locus as Cbs14a. Cbs14a explains 11% of the variation in cerebellar volume. B alleles increase cerebellar weight by 1.5 mg per allele, and show a dominance deviation of 0.6 mg (Fig. 3, panel E). No evidence for linkage near this locus is found across BXD strains.
Figure 3. Interval mapping results for BXD and F2 mice. Click image to enlarge. In each panel, the thicker black line indicates the likelihood ratio statistic at each chromosomal location (left Y axis). The thin black line indicates the associated additive effect at each location (right Y axis). The X axis is for each panel is centimorgans. (A) Interval mapping of Chr 8 for adjusted cerebellar weight in BXD strains (B) Interval mapping of Chr 8 for adjusted cerebellar volume in BXD strains (C) Composite interval mapping of Chr 1 for adjusted cerebellar weight in BXD strains (D) Composite interval mapping of Chr 1 for adjusted cerebellar volume in BXD strains (E) Interval mapping of Chr1 for adjusted cerebellar weight in F2 mice (F) Interval mapping of Chr 14 for adjusted cerebellar weight in F2 mice (G) Interval mapping of Chr 19 for adjusted cerebellar weight in F2 mice (H) Interval mapping of Chr 19 for adjusted cerebellar weight in BXD mice.
With composite interval mapping it is possible to assess the incremental or independent influence for one of several QTLs affecting a trait. Controlling unlinked QTLs may also increase the power to detect secondary QTLs. By controlling the QTL linked to D1Mit57, the LRS for the Chr 14 locus increases from 22.2 to 25.1, and the LRS for the putative QTL linked to D19Mit38 increases from 14.1 to 19.7. Thus, with control for D1Mit57, the LRS for the Chr 19 locus attains genome-wide significance. Composite interval mapping of Chr 19 with control for D1Mit57 shows the strongest linkage just proximal to D19Mit38 at 35 cM with an LRS of 21.1 (PG = .007). The additive effect is –1.7 mg per B allele. D alleles are dominant with a deviation of 0.5 mg per allele. When both the Chr 1 and Chr 14 loci are controlled, the LRS for the Chr 19 locus decreases to suggestive genome-wide significance (LRS = 10.2), and when just the Chr 14 locus is controlled, the Chr 19 LRS decreases below suggestive genome-wide significance (LRS = 6.9), indicating a lack of strong independent effect for this locus. In BXD strains, however, there is support for linkage of adjusted cerebellar weight to Chr 19 (Table 2). Close to 35 cM, this linkage is significant with a comparisonwise alpha of 0.05 (D19Mit13 at 33 cM, P = 0.02). We have named this locus Cbs19a. There is also a suggestive linkage at the more proximal end of Chr 19 in both BXD and F2 mice. The comparisonwise probability at the marker D19Mit109 (4 cM) in BXD mice is P = .017, and in F2 mice it is P = .035. The combined probability, using Fisher’s method (Sokal and Rohlf, 1995), is P = .005. The additive effect as this locus is approximately –1 mg per B allele. We have provisionally named this locus Cbs19b.
Considered collectively these loci have appreciable effect size. For example, a 7 mg difference is found between mice (n = 12) homozygous for B and D alleles at Cbs1a and Cbs14a, respectively, and mice (n = 11) homozygous for D and B alleles at these same loci, respectively. An 8 mg difference is found in mice (n = 12) homozygous for B alleles at Cbs1a and Cbs19a, and mice (n = 6) homozygous for D alleles at these loci. All four loci together account for 51% of the variance in cerebellar weight in the F2 mice.
Epistasis
The effect of one QTL may depend on allelic differences at another QTL. To examine epistasis between the QTLs identified in the present study, we tested the two-way ANOVA interactions between loci (e.g., Table 7). No two-way interactions were found to be significant; the QTLs we report here do not interact epistatically.
Discussion
Synopsis
We have discovered five new QTLs that are the first normal gene variants known to modulate the size of the vertebrate cerebellum. We have name these QTLs Cbs1a, Cbs8a, Cbs14a, Cbs19a, and Cbs19b. Among BXD recombinant inbred strains, the cerebellum averages 52 mg (12.4% of the brain) and ranges 18 mg in size. Two quantitative trait loci, on Chrs 1 (2-LOD support interval 89–102 cM) and 8 (44–53 cM), are responsible for about 6 mg of this range, a 33% effect size. In C57BL/6J x DBA/2J F2 mice, the cerebellum averages 62 mg (12.9% of the brain) and ranges in size about 20 mg. Four QTLs on Chrs 1 (81–92 cM), 14 (5–16 cM), and 19 (28–56 cM, 4–21 cM) are responsible for about 7 mg of this range, a 35% effect size. In mapping these QTLs, the effects of brain size, sex, age, and body weight on cerebellar size were examined prior to mapping and statistically controlled when necessary. Apart from brain size, which accounted for approximately 50% of cerebellar weight, we detected no discernable, independent effects on total cerebellar size for sex, age, or body weight.
Regional cerebellar effects of Cbs8a
Regional effects of cerebellar size QTLs were explored in BXD strains by examining the volume of the cell-rich internal granule layer versus the remaining volume. The IGL contains somas of two of the main cell types in the cerebellum, the Purkinje and the granule neurons. The remaining cerebellar volume includes the molecular layer where granule and Purkinje cells synapse, the internal white matter, and the deep cerebellar nuclei. Although the IGL and remaining cerebellum are significantly genetically correlated, we found that age and body weight correlated differently with these parts of the cerebellum, and we found a difference in the strength of linkage to the Chr 8 locus, Cbs8a. Age and body weight correlated more strongly with the aggregate volume of the molecular layer, internal white matter, and deep nuclei than with the volume of the internal granule layer. BXD strain differences in internal granule layer volume are more strongly associated with genotypes at Cbs8a (PG = 0.08) than the volume of the remaining cerebellum (PG = 0.53). This suggests that the main effect of Cbs8a is through cell number.
Specificity or selectivity of QTL effects
A difficult problem in correlational analyses is specificity of causation. For instance, if we mapped cerebellum size without considering the effects of total brain size, we could well map genes that do not specifically affect the cerebellum. In the present study we used residuals from linear regression models that included brain size covariates in order to map genes with selective effects on the cerebellum. Another approach to the problem of specificity is to gather many phenotypes from the same mice. For instance, in two companion studies we report QTLs in BXD and BDF2 mice for olfactory bulb (Williams et al., 2000) and hippocampus (Lu et al., 2000). QTLs for olfactory bulb weight were discovered on chromosomes 4, 6, 11, and 17. QTLs for hippocampus weight were discovered on chromosomes 1 and 5. Bulb4a on Chr 4 and Hipp1a on Chr 1 map within the same 2-LOD support intervals as the putative linkage of cerebellar white matter volume to Chr 4 and the linkage of Cbs1a to Chr 1, respectively. Yet another approach to the problem of specifity is to gather more refined phenotypes related to the primary phenotype, as Lu et al., (2000) did for hippocampal volume, and as we have done for cerebellar volume. Lu et al. (2000) reported that Hipp1a exhibits shared effects on the volume of the hippocampal complex, the hippocampus proper, the pyramidal cell layer, and the granule cell layer. Hipp1a was also observed to overlap a previously mapped locus affecting the volume of the mossy fiber projection to CA3 from granule cells (Lassalle et al., 1999). By remapping cerebellar folial pattern in BXD strains (Neumann et al., 1993) with a more complete marker set, not only did we see the linkages previously reported by Neumann and colleagues on Chrs 5, 7, and 11, but we also discovered that Cbs8a is linked to the number of fissures (LRS = 8.3, P = .005), with D alleles adding fissures. Thus, DBA/2J alleles at Cbs8a increase cerebellar weight, cerebellar volume, internal granule layer volume, and the number of cerebellar folia in BXD mice. These observations illustrate one of the advantages of recombinant inbred strains, that data are cumulative over time and across laboratories. However, they also illustrate the problem of specificity of QTL action and highlight a need for improved mapping resources and methods. QTL fine mapping (Darvasi, 1998), perhaps in combination with multiple trait QTL mapping methods (Jiang and Zeng, 1995), will help significantly in this regard.
RI strains, F2 intercrosses, and advanced intercrosses
In the present study we used recombinant inbred strains derived from the strains C57BL/6J and DBA/2J and F2 progeny from a C57BL/6J x DBA/2J intercross. Because both RI and F2 mice used in this study were derived from the same parental strains, the same alleles are assumed to be segregating in each mapping panel. However, we detected significant differences between the 34 BXD strains and our F2 progeny. The F2 progeny had heavier bodies, brains and cerebella. Such effects probably reflect heterosis (hybrid vigor). Possibly related to these phenotypic differences, two of the five QTLs we discovered, those on Chr 8 and Chr 14, were not detected in both RI and F2 mapping panels. However, Cbs8a finds support in two separate samples of BXD mice measured for both cerebellar weight and volume. Loci that are not replicated may also reflect the random assortment of alleles in relatively small samples or a mutation that has occurred in either the C57BL/6J or DBA/2J genomes since creation of the BXD strains. We are currently investigating a third mapping panel derived from C57BL/6J and DBA/2J strains. This is an advanced intercross, created by outbreeding F2 mice. Examining cerebellar size and IGL volume in this panel will allow an additional opportunity to test the QTLs we have reported here and should reduce significantly the 2-LOD support intervals of confirmed QTLs (Darvasi, 1998).
Candidate Genes
The goal of our QTL mapping is to identify genes influencing cerebellar
development. Once linkage is established, further study can procede in
three directions that complement the main goal of complex trait analysis
(Williams, 2000; Moisan, 1999). First, mapping can continue with panels
designed to reduce the interval containing the QTL, such as with advanced
intercross or congenic lines (high resolution mapping). Second, the effect
of identified genes near the QTL can be assessed (candidate gene
analysis). Third, the phenotype can be more rigorously defined or examined
during development. For example, in a developmental analysis Strom and
Williams (1998) established that a QTL that modulates retinal ganglion
cell number acts through proliferation rather than cell death, thereby
effectively eliminating the need to examine candidate genes that engage
apoptotic mechanisms. The 2-LOD support intervals which bound the QTLs we
report here are not yet sufficiently precise for effective candidate gene
analysis, but we note several genes with identified effects on the
cerebellum lie within these intervals.
On chromosome 1, the dreher mutation (dr, 88.2 cM) is
known to have quite drastic effects on the cerebellum (Sekiguchi et al.,
1992). Very recent work reveals dr to be a mutation of the LIM
homeodoman protein, Lmx1a, that disrupts development of the roof
plate, resulting in part in the loss of granule neurons in the cerebellum
(Millonig et al., 2000). Also on Chr 1 is the retinoid x receptor gene (Rxrg,
88.1 cM). Retinoic acid receptors are expressed in the cerebellum of the
rat, and granule cell loss results from teratogenic effects of the ligand
(Yamamoto et al., 1999).
On chromosome 8, four of the cadherin (Cdh) genes reside
within the 2-LOD support interval for Cbs8a (Cdh5, 51cM;
Cdh8, 46.5 cM; Cdh11, 46.5 cM; Cdh16, 50.0 cM).
Cadherins are cell adhesion molecules with widespread morphogenetic
effects and are thought to be important in regionalization of the CNS.
Cadherin 8 is expressed widely in the developing mouse brain and shows a
patterned distribution in the cerebellum (Koretmatsu and Redies, 1997;
Koretmatsu et al., 1998).
On chromosome 14, both the gene for bone morphogenetic protein 4 (Bmp4,
14 cM) and for bone morphogenetic protein receptor 1A (Bmpr1a, 13
cM) reside within the 2-LOD interval for Cbs14a. Work by Alder and
colleagues (1999) suggests that bone morphogenetic proteins can initiate
granule cell genesis, and work by Iantosca and colleagues (1999) suggests
that Bmp4 may regulate granule cell number through inhibition of
apoptosis.
Finally, on chromosome 1 both genes for fibroblast growth factor 8 (Fgf8,
45 cM) and Pax2 (43 cM) reside within the 2-LOD interval for
Cbs19a. Both genes are critical to the early development of the
cerebellum (Goldowitz and Hamre, 1998). Favor and colleagues (1996) and
Urbanek and colleagues (1997) showed that inactivation of Pax2 can
lead to loss of the cerebellum and posterior midbrain. Liu and colleagues
(1999) have more recently showed that Fgf8 regulates the cascade of
genes that transform the hindbrain into cerebellar structures.
The confidence intervals for the QTLs we have discovered are
homologous to the following chomosomal regions in humans: Cbs1a:
1q23-43, Cbs8a: 16q12-16q22, Cbs14a: 10q11-23, Cbs19a:
9q13-q24 and 11q12-q13, Cbs19b: 10q23-qter. The conserved sequence
similarity among mammals makes the likelihood high that identification of
genes that influence cerebellar development in mice will aid discovery of
homologous genes in humans.
Acknowledgment
This research project was support by a grant from the National Institute of Neurological Disorders and Stroke (R01 NS35485). The authors thank Drs. Guomin Zhou, Jing Gu, and Xiyun Peng for their assistance in generating, processing, genotyping F2 and BXD mice.This research was supported by a grant from the National Institute of Neurological Disorders and Stroke (R01 NS35485). The authors thank Drs. Emmanuel Gilissen, Guomin Zhou, Jing Gu, and Xiyun Peng for their assistance in generating, processing, and genotyping BXD and F2 mice.
References
Alder J, Lee KJ, Jessell TM, Hatten ME (1999) Generation of cerebellar granule neurons in vivo by transplantation of BMP-treated neural progenitor cells. Nat Neurosci 2(6):535-540.
Barton RA, Harvey PH (2000) Mosaic evolution of brain structure in mammals. Nature 405(6790):1055-8.
Butler W, Hodos AB (1996) Comparative Vertebrate Neuroanatomy: Evolution and Adaptation. New York: Wiley-Liss.
Churchill GA, Doerge RW (1994) Empirical threshold values for quantitative trait mapping. Genetics 138:963-971.
Darvasi A (1998) Experimental strategies for the genetic dissection of complex traits in animals. Nat Genet 18:19-24.
Dietrich WF, Katz H, Lincoln SE (1992) A genetic map of the mouse suitable for typing in intraspecific crosses. Genetics 131:423-447.
Dietrich WF, Miller JC, Steen RG, Merchant M, Damron D, Nahf R, Gross A, Joyce DC, Wessel M, Dredge RD, et al. (1994) A genetic map of the mouse with 4,006 simple sequence length polymorphisms. Nat Genet 7(2 Spec No):220-245.
Don RH, Cox PT, Wainwright BJ, Baker K, Mattick JS (1991) 'Touchdown' PCR to circumvent spurious priming during gene amplification. Nucleic Acids Res 19:4008.
Eisenman LM, Gallagher E, Hawkes R (1998) Regionalization defects in the weaver mouse cerebellum. J Comp Neurol 394(4):431-444.
Favor J, Sandulache R, Neuhauser-Klaus A, Pretsch W, Chatterjee B, Senft E, Wurst W, Blanquet V, Grimes P, Sporle R, Schughart K (1996) The mouse Pax2(1Neu) mutation is identical to a human PAX2 mutation in a family with renal-coloboma syndrome and results in developmental defects of the brain, ear, eye, and kidney. Proc Natl Acad Sci USA 93(24):13870-13875.
Finlay BL, Darlington RB (1995) Linked regularities in the development and evolution of mammalian brains. Science 268(5217):1578-1584.
Goldowitz D, Eisenman LM (1992) Genetic mutations affecting murine cerebellar structure and function. In: Genetically Defined Animal Models of Neurobehavioral Dysfunction (Driscoll, P ed.) Birkhauser: Boston pp 66-88.
Goldowitz D, Hamre K (1998) The cells and molecules that make a cerebellum. TINS 21(9):375-382.
Haley CS, Knot SA (1992) A simple regression method for mapping quantitative trait loci in line crosses using flanking markers. Heredity 69:315-324
Hegmann JP, Possidente B (1981) Estimating genetic correlations from inbred strains. Behav Genet 11:103-114.
Heintz N, Zoghbi HY (2000) Insights from mouse models into the molecular basis of neurodegeneration. Annu Rev Physiol 62:779-802.
Herrup K, Kuemerle B (1997) The compartmentalization of the cerebellum. Annu Rev Neursci 20:61-90.
Iantosca MR, McPherson CE, Ho SY, Maxwell GD (1999) Bone morphogenetic proteins-2 and -4 attenuate apoptosis in a cerebellar primitive neuroectodermal tumor cell line. J Neurosci Res 56(3):248-58.
Inouye M, Oda S (1980) Strain-specific variations in the folial pattern of the mouse cerebellum. J Comp Neurol 190:357-262.
Jiang C, Zeng ZB (1995) Multiple trait analysis of genetic mapping for quantitative trait loci. Genetics 140(3):1111-27.
Korematsu K, Redies C (1997) Expression of cadherin-8 mRNA in the developing mouse central nervous system. J Comp Neurol 387(2):291-306.
Korematsu K, Nishi T, Okamura A, Goto S, Morioka M, Hamada J, Ushio Y (1998) Cadherin-8 protein expression in gray matter structures and nerve fibers of the neonatal and adult mouse brain. Neuroscience 87(1):303-15.
Laird PW, Zijderveld A, Linders K, Rudnicki M, Jaenisch R, Berns A (1991) Simplified mammalian DNA isolation prodedure. Nucleic Acids Res 19:4293
Lander ES, Kruglyak L (1995) Genetic dissection of complex traits: guidelines for interpreting and reporting linkage results. Nat Genet 11(3):241-247
Liu A, Losos K, Joyner AL (1999) FGF8 can activate Gbx2 and transform regions of the rostral mouse brain into a hindbrain fate. Development 126(21):4827-38.
Llinás RR, Walton KD (1998) Cerebellum. In: The Synaptic Organization of the Brain, 4th ed. (Shepherd, GM ed.) Oxford University Press: New York pp 255-288.
Love JM, Knight AM, McAleer MA, Todd JA (1990) Towards construction of a high resolution map of the mouse genome using PCR-analyzed microsatellites. Nucleic Acids Res 18:4123-4130.
Lu L, Airey DC, Williams RW (in review) Genetic architecture of the mouse hippocampus: identification of gene loci with specific effects on hippocampal size. J Neurosci.
Lynch M, Walsh B (1998) Genetics and Analysis of Quantitative Traits. Sinauer Associates, Inc. Sunderland, Massachussetts.
Maynard Smith J (1998) Evolutionary Genetics, 2nd Ed. Oxford Univ Press, London.
Millonig JH, Millen KJ, Hatten ME (2000) The mouse Dreher gene Lmx1a controls formation of the roof plate in the vertebrate CNS. Nature 403(6771):764-9.
Manly KF, Olson JM (1999) Overview of QTL mapping software and introduction to map manager QT. Mamm Genome 10(4): 327-34.
Moisan MP (1999) From QTL detection to gene identification. In: Neurobehavioral Genetics: Methods and Applications. (Jones BC, Mormede P, eds.) CRC Press. pp 77-91.
Neumann PE, Garretson JD, Skaboardonis GP, Mueller GG (1993) Genetic analysis of cerebellar folial pattern in crosses of C57BL/6J and DBA/2J inbred mice. Brain Res 619(1-2):81-8.
Nunzi MG, Grillo M, Margolis FL, Mugnaini E (1999) Compartmental organization of Purkinje cells in the mature and developing mouse cerebellum as revealed by an olfactory marker protein-lacZ transgene. J Comp Neurol 404(1):97-113.
Oberdick J, Baader SL, Schilling K (1998) From zebra stripes to postal zones: deciphering patterns of gene expression in the cerebellum. TINS 21(9):383-390
Rilling JK, Insel TR (1998) Evolution of the cerebellum in primates: differences in relative volume among monkeys, apes, and humans. Brain Behav Evol 52:308-314.
Rondi-Reig L, Caston J, Delhaye-Bouchaud N, Mariani J (1999) Cerebellar functions: A behavioral neurogenetic perspective. In: Neurobehavioral Genetics: Methods and Applications. (Jones BC, Mormede P, eds.) CRC Press. pp 201-216.
Rosen GD, Harry JD (1990) Brain volume estimation from serial section measurements: a comparison of methodologies. J Neurosci Methods 35(2):115-24.
Sekiguchi M, Shimai K, Guo H, Nowakowski RS (1992) Cytoarchitectonic abnormalities in hippocampal formation and cerebellum of dreher mutant mouse. Brain Res Dev Brain Res 67(1):105-12.
Sokal RR, Rohlf FJ (1995) Biometry: The Principles and Practive of Statistics in Biological Research. pp 794-797. New York:W. H. Freeman and Company.
Strom RC, Williams RW (1998) Cell production and cell death in the generation of variation in neuron number. J Neurosci 18:9948-9953.
Taylor BA (1989) Recombinant inbred strains. In: Genetic variants and strains of the laboratory mouse 2nd Ed (Lyon ML, Searle AG, eds), pp 773—796. Oxford: Oxford UP.
Taylor BA, Wnek C, Kotlus BS, Roemer N, MacTaggart T, Philli (1999) Genotyping new BXD recombinant inbred mouse strains and comparison of BXD and consensus maps. Mamm Genome 10:335—348.
Urbanek P, Fetka I, Meisler MH, Busslinger M (1997) Cooperation of Pax2 and Pax5 in midbrain and cerebellum development. Proc Natl Acad Sci USA 94(11):5703-8.
Voogd J, Glikstein M (1998) The anatomy of the cerebellum. TINS 21(9):370-375.
Williams RW, Herrup K (1988) The control of neuron number. Annu Rev Neurosci 11:423-53.
Williams RW, Stron RC, Goldowitz D (1998) Natural variation in neuron number in mice is linked to a major quantitative trait locus on Chr 11. J Neurosci 18:138-146.
Williams RW, Airey DC, Kulkarni A, Zhou G, Lu L. (in press) Genetic dissection of the olfactory bulbs of mice: QTLs on chromosomes 4, 6, 11, and 17 modulate bulb size. Behav Genet.
Williams RW (2000) Mapping genes that modulate mouse brain development: a quantitative genetic approach. In: Mouse Brain Development. (Goffinet A, Rakic P, eds), pp 21-49. Berlin: Springer.
Yamamoto M, Ullman D, Drager UC, McCaffery P (1999) Postnatal effects of retinoic acid on cerebellar development. Neurotoxicol Teratol 21(2):141-6.
Zhou G, Williams RW (1999) Eye1 and Eye2: Gene loci that modulate eye size, lens weight, and retinal area in mouse. Invest Ophthalmol Vis Sci 40:817-825.
TABLES
Table 1. BXD strain means for cerebellar phenotypes. Columns containing "adjusted" values reflect weights or volumes after covariance with brain size has been removed.
Table 2. Significant Comparisonwise Linkages for Adjusted Cerebellar Weight in BXD Mice. The criteria for significance was set to alpha = 0.01.
Table 3. Significant Comparisonwise Linkages for Adjusted Cerebellar Volume in BXD Mice. The criteria for significance was set to alpha = 0.01.
Table 4. Significant Comparisonwise Linkages for Adjusted Internal Granule Volume in BXD Mice. The criteria for significance was set to alpha = 0.01.
Table 5. Significant Comparisonwise Linkages for Adjusted Cerebellar "White matter" (Total Volume – IGL Volume) in BXD Mice. The criteria for significance was set to alpha = 0.01.
Table 6. Significant Comparisonwise Linkages for Adjusted Cerebellar Weight in F2 Mice. The criteria for significance was set to alpha = 0.01.
Table 7. Epistasis ANOVA for QTLs Controlling Cerebellar Weight in BXD Mice.
| Tabel 1. Cerebellum Weight and Volume in BXD Recombinant Inbred Strains | |||||||||||||
|
Adjusted |
Adjusted |
Adjusted |
|||||||||||
|
Cerebellum |
Cerebellum |
Brain |
Cerebellum |
Cerebellum |
IGL |
IGL |
|||||||
|
Strain |
N |
Weight1 |
Weight2 |
Weight3 |
N4 |
Volume5 |
Volume6 |
Volume7 |
Volume8 |
||||
|
1 |
5 |
61.4 ± 2.38 |
54.1 ± 0.95 |
483 ± 20.3 |
5 |
49.8 ± 2.32 |
46.0 ± 1.89 |
20.3 ± 1.81 |
18.7 ± 1.60 |
||||
|
2 |
5 |
49.0 ± 1.25 |
50.1 ± 0.71 |
403 ± 8.6 |
6 |
45.5 ± 1.23 |
44.9 ± 1.42 |
15.0 ± 0.93 |
14.8 ± 0.91 |
||||
|
5 |
5 |
62.5 ± 2.32 |
53.3 ± 1.01 |
501 ± 13.0 |
4 |
62.9 ± 3.55 |
52.5 ± 3.41 |
23.0 ± 0.20 |
18.7 ± 0.50 |
||||
|
6 |
7 |
53.1 ± 1.22 |
55.1 ± 0.71 |
403 ± 5.0 |
- |
- |
- |
- |
- |
||||
|
8 |
7 |
59.1 ± 2.07 |
57.3 ± 0.32 |
438 ± 22.9 |
8 |
55.1 ± 1.64 |
54.3 ± 1.87 |
22.7 ± 1.00 |
22.4 ± 1.16 |
||||
|
9 |
7 |
53.9 ± 1.05 |
51.2 ± 0.99 |
448 ± 9.6 |
5 |
47.3 ± 1.10 |
45.8 ± 1.02 |
18.8 ± 0.55 |
18.1 ± 0.55 |
||||
|
11 |
5 |
53.1 ± 1.10 |
53.6 ± 0.79 |
408 ± 5.8 |
5 |
50.6 ± 1.21 |
49.0 ± 1.01 |
19.5 ± 0.82 |
18.9 ± 0.78 |
||||
|
12 |
5 |
45.9 ± 1.09 |
46.8 ± 0.83 |
405 ± 16.9 |
6 |
43.8 ± 1.75 |
42.6 ± 1.30 |
16.4 ± 1.04 |
16.0 ± 0.86 |
||||
|
13 |
5 |
48.4 ± 1.63 |
50.6 ± 0.65 |
392 ± 12.9 |
5 |
47.9 ± 1.18 |
48.3 ± 1.09 |
18.6 ± 1.78 |
18.8 ± 1.64 |
||||
|
14 |
5 |
49.4 ± 0.44 |
49.3 ± 0.44 |
414 ± 6.6 |
5 |
47.1 ± 1.71 |
45.0 ± 1.64 |
15.8 ± 0.69 |
14.9 ± 0.91 |
||||
|
15 |
7 |
47.4 ± 1.15 |
45.7 ± 0.38 |
437 ± 14.2 |
5 |
44.5 ± 0.87 |
41.6 ± 0.80 |
15.2 ± 0.53 |
14.0 ± 0.54 |
||||
|
16 |
5 |
56.3 ± 1.21 |
52.5 ± 0.68 |
450 ± 6.8 |
- |
- |
- |
- |
- |
||||
|
18 |
5 |
53.6 ± 1.44 |
52.0 ± 0.68 |
429 ± 11.9 |
5 |
47.5 ± 2.23 |
47.8 ± 2.06 |
18.6 ± 1.27 |
18.8 ± 1.11 |
||||
|
19 |
6 |
50.1 ± 1.42 |
51.1 ± 0.62 |
409 ± 15.9 |
5 |
46.4 ± 1.16 |
45.8 ± 0.64 |
18.5 ± 1.19 |
18.3 ± 1.30 |
||||
|
20 |
5 |
48.2 ± 1.67 |
52.4 ± 0.75 |
374 ± 13.3 |
5 |
43.2 ± 0.96 |
45.8 ± 0.83 |
14.5 ± 0.57 |
15.9 ± 0.53 |
||||
|
21 |
7 |
50.6 ± 1.31 |
49.0 ± 0.77 |
437 ± 8.7 |
- |
- |
- |
- |
- |
||||
|
22 |
5 |
53.8 ± 1.51 |
51.6 ± 0.64 |
435 ± 12.3 |
5 |
50.4 ± 1.47 |
48.0 ± 1.03 |
21.6 ± 1.56 |
20.6 ± 1.50 |
||||
|
23 |
5 |
48.6 ± 1.03 |
50.7 ± 0.34 |
394 ± 8.1 |
5 |
43.1 ± 1.21 |
43.9 ± 1.61 |
16.4 ± 0.77 |
16.8 ± 0.76 |
||||
|
24 |
5 |
54.9 ± 1.92 |
55.5 ± 1.18 |
408 ± 9.6 |
5 |
50.7 ± 3.52 |
52.2 ± 3.52 |
21.1 ± 1.73 |
21.8 ± 1.71 |
||||
|
25 |
5 |
49.6 ± 0.81 |
52.6 ± 0.33 |
385 ± 4.9 |
5 |
45.1 ± 1.05 |
46.6 ± 0.75 |
17.3 ± 1.13 |
17.9 ± 1.01 |
||||
|
27 |
5 |
47.4 ± 2.25 |
53.1 ± 0.61 |
359 ± 16.2 |
5 |
43.5 ± 2.00 |
49.3 ± 1.44 |
16.9 ± 1.15 |
19.3 ± 1.11 |
||||
|
28 |
5 |
51.5 ± 0.87 |
53.5 ± 0.58 |
394 ± 4.3 |
5 |
47.7 ± 1.90 |
49.3 ± 1.93 |
18.9 ± 0.98 |
19.5 ± 0.88 |
||||
|
29 |
5 |
50.2 ± 0.56 |
53.2 ± 0.30 |
385 ± 4.5 |
5 |
40.9 ± 2.35 |
46.0 ± 1.31 |
14.9 ± 1.10 |
17.0 ± 0.82 |
||||
|
30 |
5 |
53.6 ± 1.14 |
58.7 ± 0.79 |
365 ± 6.2 |
5 |
47.9 ± 2.11 |
52.6 ± 1.47 |
17.8 ± 1.01 |
19.8 ± 0.84 |
||||
|
31 |
5 |
49.7 ± 0.91 |
50.8 ± 0.58 |
403 ± 8.5 |
5 |
46.0 ± 1.81 |
46.8 ± 2.04 |
16.5 ± 1.37 |
16.9 ± 1.49 |
||||
|
32 |
5 |
56.0 ± 1.19 |
53.3 ± 0.98 |
439 ± 6.0 |
4 |
55.1 ± 3.66 |
51.5 ± 3.28 |
21.2 ± 0.65 |
19.7 ± 0.64 |
||||
|
33 |
5 |
52.1 ± 0.66 |
51.9 ± 0.57 |
445 ± 3.0 |
4 |
48.2 ± 3.13 |
47.7 ± 3.61 |
19.5 ± 1.24 |
19.3 ± 1.50 |
||||
|
34 |
5 |
53.7 ± 1.22 |
54.1 ± 0.68 |
439 ± 5.2 |
5 |
50.4 ± 2.85 |
51.0 ± 2.10 |
18.7 ± 1.57 |
18.9 ± 1.27 |
||||
|
35 |
4 |
49.7 ± 2.03 |
52.3 ± 0.75 |
417 ± 14.4 |
5 |
46.9 ± 1.96 |
48.2 ± 1.19 |
17.6 ± 1.17 |
18.2 ± 0.92 |
||||
|
36 |
5 |
44.5 ± 0.73 |
46.1 ± 0.30 |
427 ± 6.3 |
5 |
40.9 ± 1.29 |
42.5 ± 0.87 |
14.6 ± 0.56 |
15.3 ± 0.61 |
||||
|
38 |
4 |
51.1 ± 1.79 |
51.8 ± 0.78 |
436 ± 9.6 |
5 |
45.5 ± 2.46 |
45.8 ± 2.00 |
16.8 ± 1.01 |
16.9 ± 0.78 |
||||
|
39 |
5 |
54.9 ± 0.87 |
57.0 ± 0.46 |
423 ± 5.3 |
4 |
50.6 ± 1.64 |
52.6 ± 0.41 |
18.9 ± 1.42 |
19.8 ± 0.94 |
||||
|
40 |
4 |
49.9 ± 1.13 |
48.6 ± 0.43 |
455 ± 8.2 |
5 |
44.9 ± 3.90 |
44.2 ± 3.87 |
18.1 ± 0.86 |
17.8 ± 0.97 |
||||
|
42 |
5 |
59.4 ± 0.95 |
56.6 ± 0.25 |
469 ± 7.0 |
5 |
53.4 ± 1.37 |
51.1 ± 1.01 |
21.7 ± 0.94 |
20.8 ± 0.82 |
||||
|
Mean9 |
52.1 |
52.2 |
420 |
47.8 |
47.7 |
18.2 |
18.2 |
||||||
|
SD9 |
4.24 |
3.01 |
31.9 |
4.56 |
3.33 |
2.37 |
1.02 |
||||||
| (-) Not available or not measured. | |||||||||||||
| 1. Mean ± SE (mg) for unadjusted observations. | |||||||||||||
| 2. Means for Cb Weighti – [5.66 + 0.11(Brain Weighti) + 3.06(Dissector Identityi)] + Cb Weight Grand Mean; see Methods. | |||||||||||||
| 3. Unadjusted observations. These values also represent expected brain volumes in cubic mm; see Methods. | |||||||||||||
| 4. Independent sets of mice were used for weight and volume estimates. | |||||||||||||
| 5. Mean ± SE (cubic mm). Adjusted for tissue shrinkage (Cb volume/brain volume x expected brain volume; see Methods). | |||||||||||||
| 6. Cb Volumei – [9.23 + 0.09(Expected Brain Volumei)] + Cb Volume Grand Mean. | |||||||||||||
| 7. Adjusted for tissue shrinkage (IGL volume/brain volume x expected brain volume; see Methods). | |||||||||||||
| 8. IGL Volumei – [2.00 + 0.04(Expected Brain Volumei)] + IGL Volume Grand Mean. | |||||||||||||
| 9. Calculated from strain estimates, not from individual observations. | |||||||||||||
| Table 2. Significant Comparisonwise Linkages for Adjusted Cerebellar Weight in BXD Mice | |||||
|
Locus |
Chr:cM |
LRS |
Percent Variance Explained |
Probability |
Additive Effect per B allele |
| D1Mit213 | 1:26 | 9.2 |
21 |
0.00237 | –1.45 |
| D1Mit113 | 1:92 | 8.9 |
21 |
0.00289 | –1.45 |
| D1Mit150 | 1:100 | 9.5 |
22 |
0.00201 | –1.48 |
| D1Mit426 | 1:101 | 11.1 |
26 |
0.00084 | –1.58 |
| D8Mit147 | 8:43 | 16.3 |
36 |
5.5e-5 | –1.84 |
| D8Mit312 | 8:45 | 19.7 |
42 |
9.3e-6 | –1.98 |
| D8Mit211 | 8:49 | 19.2 |
41 |
1.2e-5 | –2.08 |
| D8Mit113 | 8:53 | 14.3 |
32 |
0.00016 | –1.82 |
| D16Mit152 | 16:57 | 7.3 |
17 |
0.00698 | +1.34 |
| D19Mit40 | 19:25 | 7.8 |
19 |
0.00519 | –1.32 |
| Table 3. Significant Comparisonwise Linkages for Adjusted Cerebellar Volume in BXD Mice | |||||
|
Locus |
Chr:cM |
LRS |
Percent Variance Explained |
Probability |
Additive Effect per B allele |
| D1Mit113 | 1:92 | 15.6 |
38 |
7.7e-5 | –2.08 |
| D1Mit150 | 1:100 | 13.4 |
33 |
0.00025 | –1.95 |
| D1Mit426 | 1:101 | 14.4 |
35 |
0.00015 | –2.00 |
| D4Mit303 | 4:49 | 8.1 |
21 |
0.00435 | +1.61 |
| D8Mit147 | 8:43 | 11.4 |
28 |
0.00074 | –1.83 |
| D8Mit312 | 8:45 | 15.3 |
37 |
9.3e-5 | –2.06 |
| D8Mit211 | 8:49 | 18.8 |
44 |
1.5e-5 | –2.31 |
| D8Mit113 | 8:53 | 10.7 |
27 |
0.00104 | –1.83 |
| D16Mit106 | 16:69 | 7.4 |
19 |
0.00663 | +1.57 |
| Table 4. Significant Comparisonwise Linkages for Adjusted Internal Granule Volume in BXD Mice | |||||
|
Locus |
Chr:cM |
LRS |
Percent Variance Explained |
Probability |
Additive Effect per B allele |
| D1Mit113 | 1:92 | 8.9 |
22 |
0.00293 | –0.99 |
| D1Mit150 | 1:100 | 7.3 |
18 |
0.00696 | –0.91 |
| D1Mit426 | 1:101 | 10.1 |
25 |
0.00145 | –1.05 |
| D5Mit372 | 5:73 | 7.0 |
18 |
0.00800 | –0.89 |
| D5Mit168 | 5:80 | 8.5 |
21 |
0.00358 | –0.98 |
| D6Mit236 | 6:3 | 7.9 |
20 |
0.00503 | –0.95 |
| D6Mit33 | 6:26 | 7.7 |
19 |
0.00560 | –0.97 |
| D6Mit183 | 6:27 | 8.6 |
22 |
0.00338 | –1.04 |
| D6Mit29 | 6:37 | 8.4 |
21 |
0.00371 | –0.97 |
| D7Mit114 | 7:8 | 8.4 |
21 |
0.00380 | +1.10 |
| D7Mit227 | 7:17 | 7.2 |
18 |
0.00737 | +0.91 |
| D8Mit145 | 8:33 | 8.0 |
20 |
0.00467 | –0.95 |
| D8Mit147 | 8:43 | 10.5 |
26 |
0.00119 | –1.07 |
| D8Mit312 | 8:45 | 12.8 |
32 |
0.00034 | –1.16 |
| D8Mit211 | 8:49 | 12.7 |
31 |
0.00037 | –1.20 |
| D8Mit113 | 8:53 | 8.5 |
21 |
0.00349 | –1.00 |
| D16Mit152 | 16:57 | 8.8 |
22 |
0.00304 | +1.01 |
| Table 5. Significant Comparisonwise Linkages for Adjusted Cerebellar "White matter" (Total Volume – IGL Volume) in BXD Mice | |||||
|
Locus |
Chr:cM |
LRS |
Percent Variance Explained |
Probability |
Additive Effect per B allele |
| D1Mit113 | 1:92 | 9.8 |
25 |
0.00170 | –0.98 |
| D1Mit150 | 1:100 | 9.1 |
23 |
0.00254 | –0.95 |
| D1Mit426 | 1:101 | 7.6 |
19 |
0.00598 | –0.87 |
| D4Mit303 | 4:49 | 13.0 |
33 |
0.00031 | +1.13 |
| D8Mit211 | 8:49 | 9.1 |
23 |
0.00251 | –0.99 |
| D10Mit10 | 10:51 | 7.5 |
19 |
0.00611 | –0.90 |
| D16Mit106 | 16:69 | 6.7 |
17 |
0.00961 | +0.86 |
| Table 6. Significant Comparisonwise Linkages for Adjusted Cerebellar Weight in F2 Mice | ||||||
|
Locus |
Chr:cM |
LRS |
Percent Variance Explained |
Probability |
Additive Effect per B Allele |
Dominance Deviation |
| D1Mit80 | 1:51 | 16.2 |
8 |
0.00030 | –1.10 | –0.88 |
| D1Mit387 | 1:65 | 17.8 |
9 |
0.00014 | –1.26 | +0.10 |
| D1Mit103 | 1:75 | 24.2 |
12 |
5.7e-6 | –1.49 | –0.76 |
| D1Mit57 | 1:85 | 66.0 |
32 |
4.6e-15 | –2.26 | –1.09 |
| D1Mit145 | 1:87 | 51.9 |
25 |
5.3e-12 | –2.01 | –0.77 |
| D1Mit356 | 1:94 | 42.9 |
21 |
4.9e-10 | –1.82 | –0.31 |
| D12Mit2 | 12:16 | 12.1 |
6 |
0.00241 | +1.09 | +0.23 |
| D14Mit207 | 14:8 | 22.2 |
11 |
1.5e-5 | +1.47 | +0.61 |
| D19Mit127 | 19:9 | 11.5 |
5 |
0.00322 | –1.10 | +0.47 |
| D19Mit16 | 19:13 | 13.6 |
6 |
0.00111 | –1.24 | +0.33 |
| D19Mit38 | 19:35 | 14.3 |
10 |
0.00077 | –1.67 | –0.12 |
| D19Mit137 | 19:56 | 14.1 |
7 |
0.00086 | –1.15 | +0.17 |
| Table 7. Epistasis ANOVA for QTLs Controlling Cerebellar Weight in BXD Micea | |||||
|
Source |
df |
SS |
MS |
F-ratio |
Probability |
| Const |
1 |
92718 | 92718 | 26352 | < 0.0001 |
| Cbs1a |
1 |
62.2 | 62.2 | 17.6 | 0.0002 |
| Cbs8a |
1 |
111.2 | 111.2 | 31.6 | < 0.0001 |
| Cbs1a*Cbs8a |
1 |
2.6 | 2.6 | 0.7 | 0.3957 |
| Error |
30 |
105.5 | 3.5 | ||
| Total |
33 |
299.6 | |||
a
: Results for cerebellar volume are not differentSince Aug 1, 2000